A Deep Dive on US Healthcare
A comprehensive, data-driven analysis of the best opportunities in a $5 trillion sector
What You Will Learn
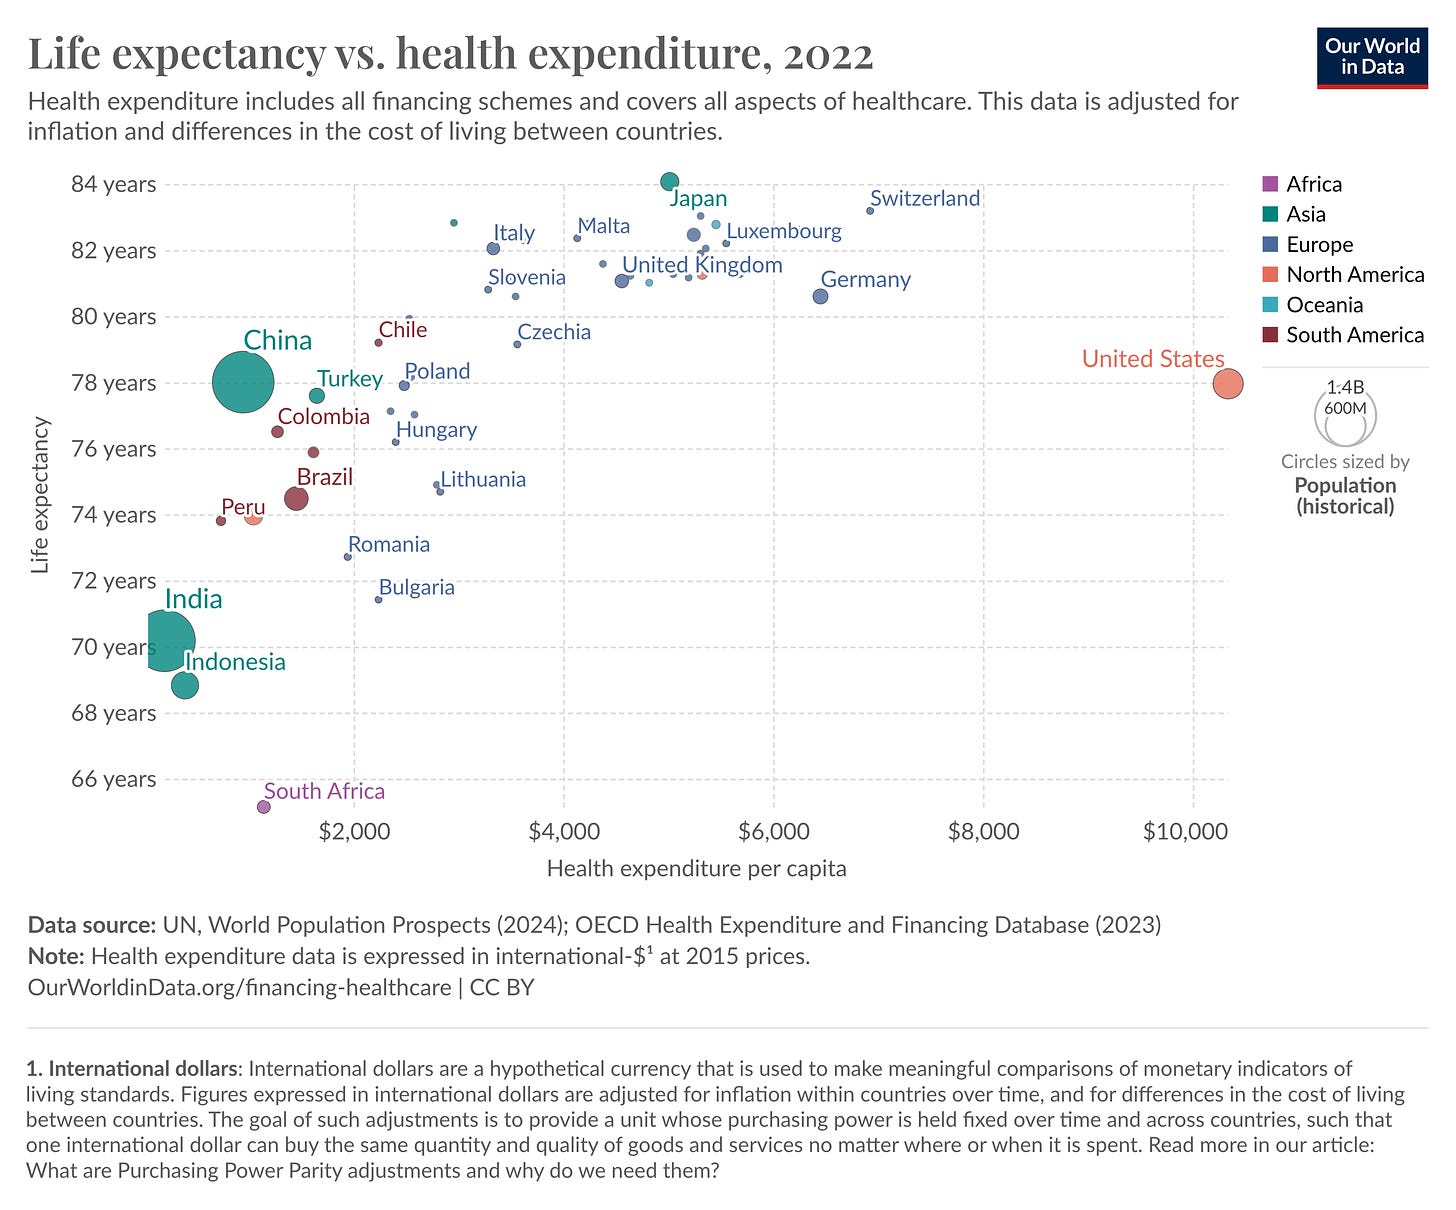
Why does the US experience the worst health outcomes of any high-income nation despite spending by far the most on healthcare?
Who are the key stakeholders in the healthcare value chain, how do they make money, and how do they differentiate themselves?
There is one industry within healthcare that has outperformed everything else - why is that?
Where are the best opportunities for investors and entrepreneurs?
Why have most attempts to make healthcare more efficient failed?
How is AI creating an “iPhone Moment” for healthcare?
Introduction
When people ask for investment ideas, they usually want to hear about exciting industries like AI, semiconductors, EVs, or cloud computing. US healthcare by contrast seems hopelessly opaque with its complex network of relationships, strict regulations, and a deep-rooted resistance to change.
There is no doubt that healthcare is hard. But it also presents enormous opportunities for investors and founders.
$5 trillion is spent on healthcare each year in the US. That is a mind-bogglingly large number, amounting to nearly five times the size of the global advertising market.
The US oncology (cancer) drugs market alone is valued at $104 billion as of 2024. That’s larger than the entire US cybersecurity market!
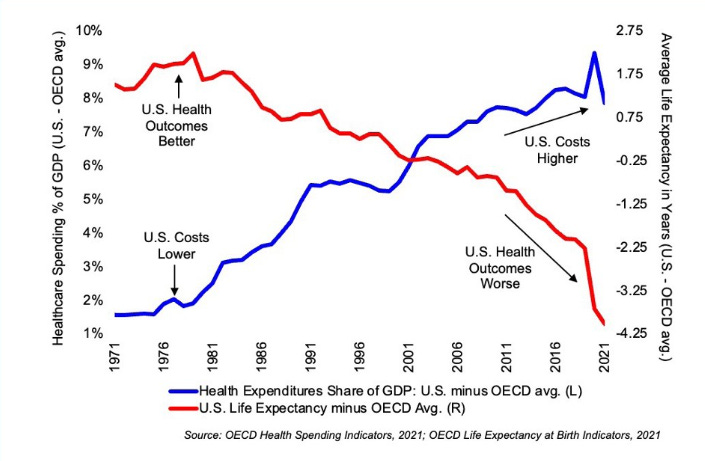
And yet Americans experience the worst health outcomes of any high-income nation.
Of all high-income nations, the US has the lowest life expectancy, the highest infant mortality rates, the highest obesity rates, pays the most for prescription drugs, and is the only high-income country that doesn’t guarantee health coverage.
However, despite the glaring inefficiency of the system, it has remained stubbornly immune to attempts at disruption.
Even Haven, the joint venture between three of the most powerful US companies - Amazon, Berkshire Hathaway, and JP Morgan, shut down after three years as they lacked the market power to negotiate lower prices.
When even Amazon, the company that disrupted retail, pioneered cloud computing and counts over half of the US population as Prime members fails time and time again to disrupt your business, you have one heck of a competitive moat.
In this deep dive, I will give an in-depth overview of the US healthcare landscape and its key players, provide my opinion on their competitive positioning and rank their investment potential, and why I believe now is one of the most exciting times to be an investor or entrepreneur in the digital health space.
“The harder the problem, the more limited the competition, and the greater the reward for whoever can solve it”
-Stephen A. Schwarzman, co-founder and CEO of Blackstone
Table of Contents
History of US Healthcare
US Healthcare Value Chain
Purchasers
Payers
Providers
Distributors
Producers
Ranking by Investment Attractiveness
Attempts at Reform
Regulation
Digital Health
Payment Models
Industry Outlook
AI Creating an “iPhone Moment” for Healthcare
Consumers Will Lead the Change
Conclusion
Note: In compiling this report, I conducted weeks of primary and secondary research in my free time, including perusing academic papers and datasets, financial statements, books such as “An American Sickness” and “The Innovator’s Prescription”, industry reports, industry blogs, and consulted with operators in the space.
I also created all the market maps and valuation scatterplots you will see. All valuation and return data are as of market close on November 29, 2024. Enjoy!
History of US Healthcare
Today, a quarter of Americans are either uninsured or underinsured and 60,000 Americans die each year due to lack of access to timely care.
How did Americans come to depend on health insurance to pay their medical bills and why has it become so unaffordable? To answer that, we need to discuss its origins.
Health insurance first emerged in the 1920s as a self-purchased product, offering protection against financial disaster in the case of a very costly medical issue. As technology improved, costs mounted both for patients and hospitals, leading insurance to become more commonplace.
In 1939, Blue Cross Plans emerged as a non-profit, offering plans covering hospital stays for the purpose of keeping hospitals afloat while protecting patient savings. During WWII, as wages were frozen and health benefits were a tax-free form of compensation, leading employers began offering health insurance to attract workers.
In the 1950s hospital costs doubled due to advances in medicine and payment changes that encouraged expansion. As a result, between 1940 and 1955 , the number of insured Americans rose from 10% to over 60% as employer-sponsored insurance became widespread. Employer coverage evolved from protection against catastrophic events to comprehensive coverage that paid for everything.
As it became more difficult for the elderly and low-income to afford insurance, President Lyndon B. Johnson established Medicare and Medicaid in 1965, providing healthcare coverage to Americans over 65, individuals under 65 with permanent disabilities, and low-income individuals.
As the industry grew, for-profit companies such as Aetna and Cigna started to emerge that offered varying levels of coverage with prices dependent on factors like age. By the 1990s, some Blue Cross plans were converted to for-profit entities in order to meet mounting costs.
This gradual shift to a for-profit industry, enabled by relaxed regulations, led to the proliferation of powerful middlemen, administration costs, and high wages and expensive treatments that raised healthcare costs from $146 per capita in 1960 to $13,493 per capita in 2022 while outcomes continue getting worse.
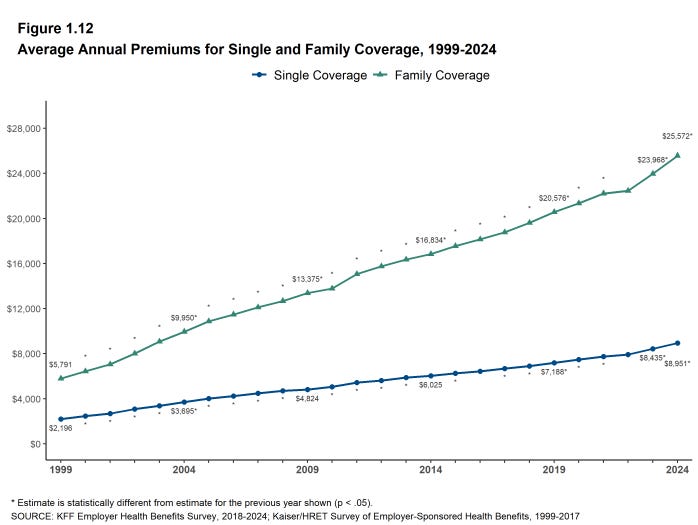
Insurers have pushed increasing costs and inefficiencies further down the value chain by increasing premiums. The average premium for family coverage rose from $5,791 in 1999 to $25,572 in 2024, significantly outpacing growth in inflation and workers wages. This has contributed to our current cost crisis, where 500,000 Americans go bankrupt each year due to medical debt.
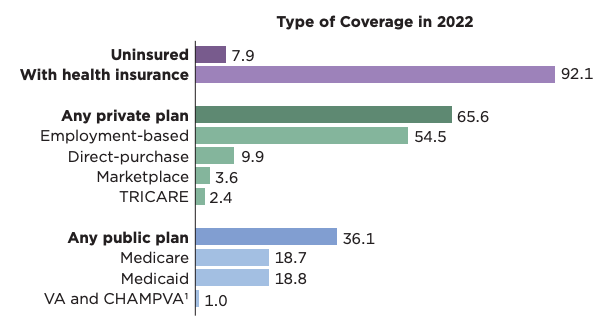
As of 2022, 92.1% of Americans were insured. 54.5% of Americans received coverage through their employers, 10% of Americans bought their own coverage, 37.5% received coverage through Medicare/Medicaid, and the remainder through other government programs such as TRICARE and VA for military service members and veterans.
The US Healthcare Value Chain
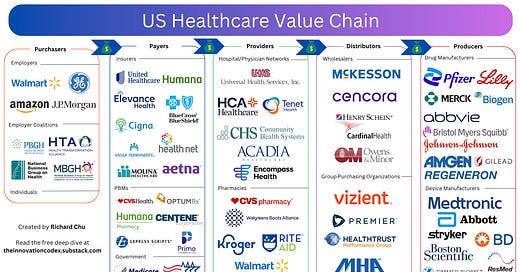
I’ve divided the US healthcare sector into 5 distinct groups based on their role in delivering healthcare services to consumers.
Purchasers - buy health insurance; ultimate recipients of medical care
Payers - provide insurance coverage; reimburse providers for services
Providers - provide healthcare services to patients
Distributors - manage the supply chain between producers and providers
Producers - develop and manufacture medical devices and pharmaceuticals
In the following sections, I will discuss each segment of the value chain, their business models, and how attractive they are from an investment standpoint ranging from S-tier (most attractive) to D-tier (least attractive).
1. Purchasers
Who are Purchasers?
Purchasers buy health insurance either for themselves in the case of individuals, or for others in the case of employers. They are different from payers in that they don’t directly reimburse healthcare providers for care provided and don’t take on financial risk.
Purchasers fall into three categories:
Employers
Employer Coalitions
Individuals
Employers: Employers can provide health insurance under a fully insured model or a self-insured model.
Under a fully insured model, employers contract with insurers that assume all financial risk with predictable fixed premiums.
Under a self-insured model, employers assume the majority of financial risk and must set aside funds to cover claims; because of this, they could be considered payers. However, even under a self-insured plan, employers typically leverage third-party administrators via traditional insurance companies to handle claims payments.
Most large employers choose to self-insure, with 72% offering self-insured plans in 2022 compared to only 16% of small employers. However, self-insured employers actually end up paying 10% more as even the largest employers like Walmart lack negotiating power, so the percentage of employers that are self-insured has steadily declined.
Within employers, small employers pay the most, with an average per-employee annual health benefits cost of $16,464 for firms with under 500 employees vs $15,640 for firms with more. Workers at firms with under 200 employees also pay nearly $2,500 more on average for family coverage than those at large firms.
Employer Coalitions: There are employer coalitions such as the Health Transformation Alliance which provides benefits for 6 million employees and have been able to negotiate some discounts, such as a 15% drug cost reduction with PBMs.
However, efforts at organizing employer coalitions have had mixed results due to increasing consolidation at other ends of the value chain. Even large employer coalitions like Haven, the joint venture between Amazon, Berkshire, and JP Morgan, failed to successfully negotiate provider prices down.
Though there are some success stories. The Alliance (Wisconsin) has negotiated rates at 150% of Medicare rates, significantly lower than the state average of 300%.
Individuals: Self-employed workers, part-time workers without coverage, or early retirees who are not yet eligible for Medicare make up the 10% of Americans that purchase health insurance directly. As they hold very little power compared to employers that are able to pool risk, their costs are significantly higher.
On average, individuals can expect to pay an annual premium of $7,008, compared to the average employee contribution for employer-sponsored plans of $1,368.
Key Takeaways
Overall, the purchaser landscape is quite fragmented and thus they do not exert much power over the premiums they pay.
The lack of negotiating power among purchasers is evident when comparing the prices they pay against the largest payer, Medicare. Studies have shown that the price differential paid by employers for hospital services rose from 10% above the Medicare rate in 2005 to over 254% above Medicare rates in 2022!
With the annual premium for individual coverage rising more than $225 per year on average and family coverage rising more than $700 per year on average from 2010 to 2022, there is a significant incentive for purchasers, whether they be employers or individuals, to enact change.
As I’ll discuss in the last section of this report, I believe the potential for digital health companies to sell directly to consumers and self-insured employers is immense. For self-insured employers in particular, just 1-2% of members drive 30-35% of annual claims. If there are solutions that keep employees healthy, it’s a win-win for everyone.
2. Payers
Who are Payers?
Payers directly reimburse healthcare providers for services to patients, making money through insurance coverage or in the case of Medicare, funded by the US government.
Payers fall into four categories:
Government Payers (Medicare, Medicaid, TRICARE/VA)
Commercial Payers (UnitedHealth, Aetna, Humana, etc.)
Private Non-Profit Payers (Kaiser Permanente, most of Blue Cross Blue Shield, etc.)
Pharmacy Benefit Managers (OptumRx, CVS Caremark, Express Scripts, etc.)
Government Payers: The federal government offers two main programs: Medicare, which covers individuals over 65 and those with certain disabilities, and Medicaid, which covers low-income individuals and families. They are the largest payer and cover 37.5% of the US population. As a result, they pay the best prices.
Medicare is made up of four parts:
Part A (Hospital Insurance)
Covers inpatient hospital care (overnight stays) and skilled nursing facilities
Most eligible people receive Part A free of premiums
Part B (Medical Insurance)
Covers outpatient services (does not require hospital stay), doctor visits, preventative services, and medical equipment
Requires monthly premium payment
Part C (Medicare Advantage)
Health plans offered through private insurers that are approved by Medicare
Provides the same coverage as Parts A and B with additional benefits such as dental, vision, and drug coverage
Part D (Prescription Drug Coverage)
Helps cover the cost of prescription medications for drugs that are not covered under Parts A or B
Medicaid meanwhile offers a wider range of services including hospital and doctor visits, prescription drugs, mental health services, and long-term care for little to no premiums. It is administered jointly by the federal and state governments.
As I’ll explain in a later section, Medicare Part C and D and many Medicaid programs are contracted through commercial payers, which form a very important profit pool for them.
Commercial Payers: Commercial insurers cover 68% of the US population.
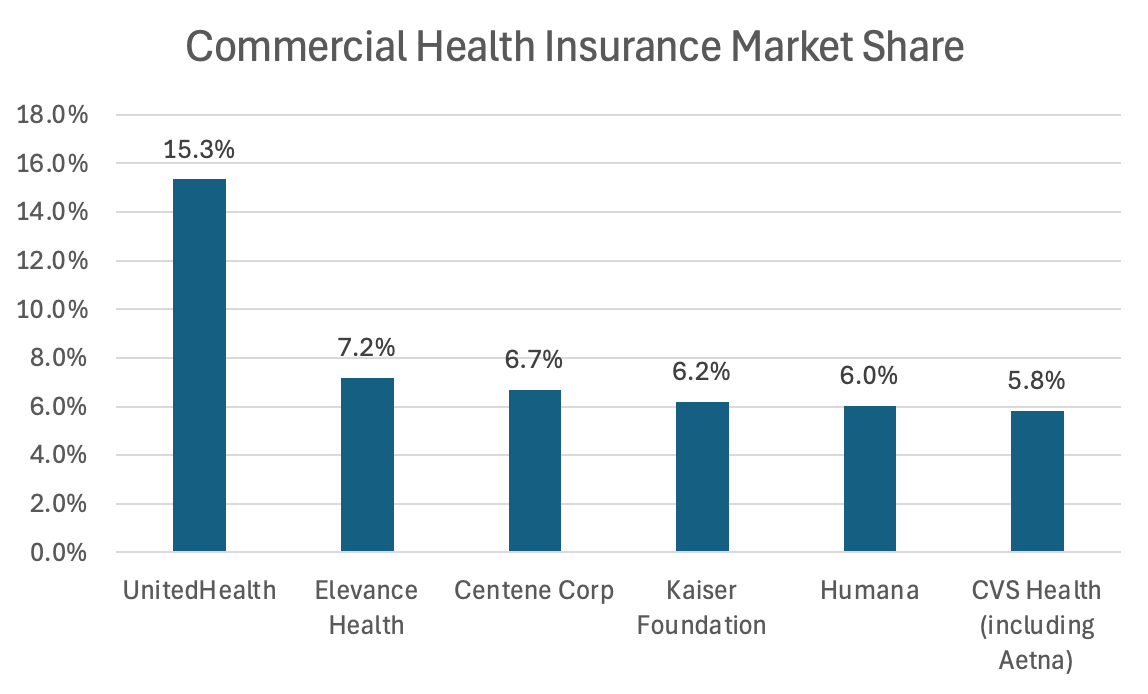
There are 1,160 health insurers in the US as of 2022, but just five companies – UnitedHealth, Elevance Health, Centene, Kaiser Permanente, and Humana, hold over 40% market share of the commercial market. Of these, only Kaiser is non-profit.
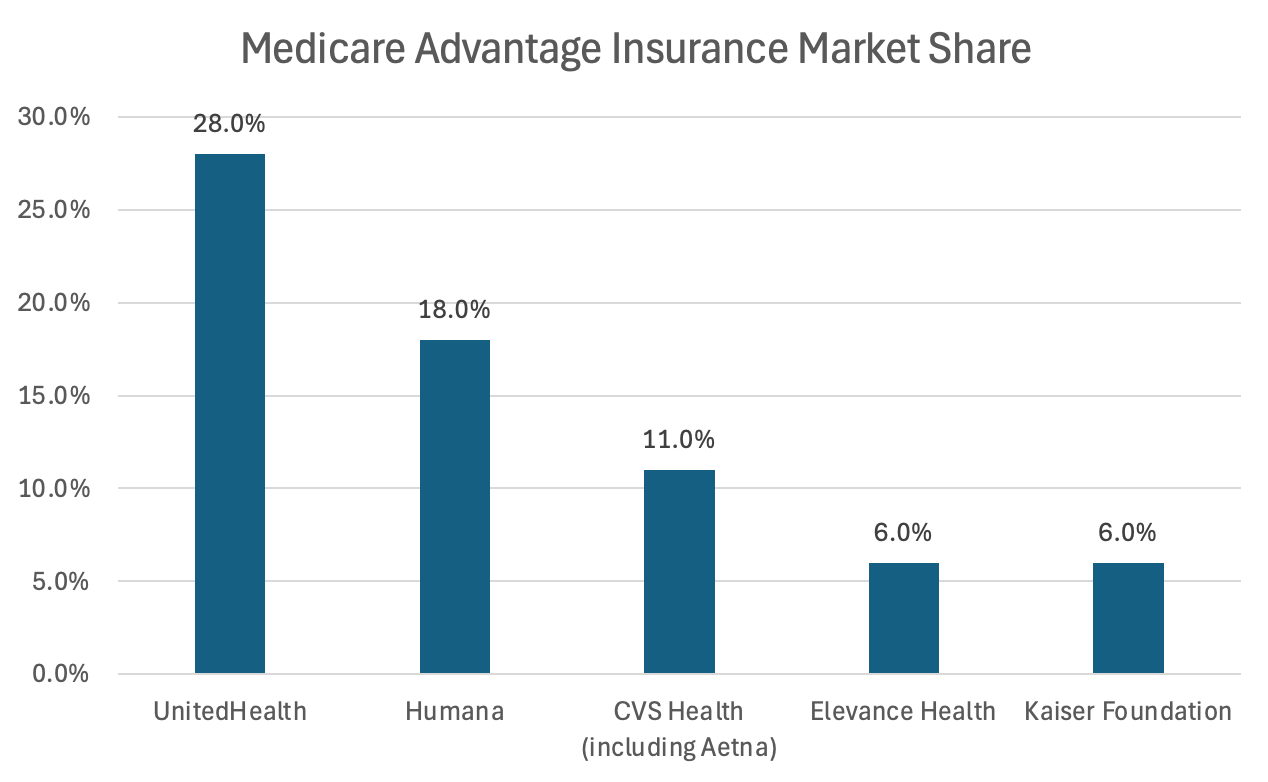
UnitedHealth dominates the Medicare Advantage market with 28% market share.
The two most common types of health insurance plans offered are health maintenance organizations (HMOs) and preferred provider organizations (PPOs).
HMOs require members to use in-network doctors and hospitals while PPOs allow members to see any doctor but incentivize staying within the preferred network.
Both commercial and non-profit insurers make money by charging payers premiums for coverage, paying out a certain percentage of the premiums to providers based on negotiated rates. Similar to typical insurance companies, they also invest the premiums before they are paid out as claims.
Non-Profit Payers: Kaiser Permanente and about 80% of Blue Cross Blue Shield are non-profit. They operate similarly to commercial insurers but must invest surplus back into the organization. This results in slightly lower premiums on average.
However, non-profits also have less reach, less plan variety, and smaller provider networks.
PBMs: Pharmacy benefit managers (PBMs) are contracted to manage prescription drug benefits.
PBMs make money by charging insurers a higher price for a drug than what they pay to the pharmacy, pocketing the difference. They also negotiate rebates from drug manufacturers in exchange for including their drugs on their formulary (a list of drugs covered by a plan). They may charge admin fees to insurers and network fees to pharmacies.
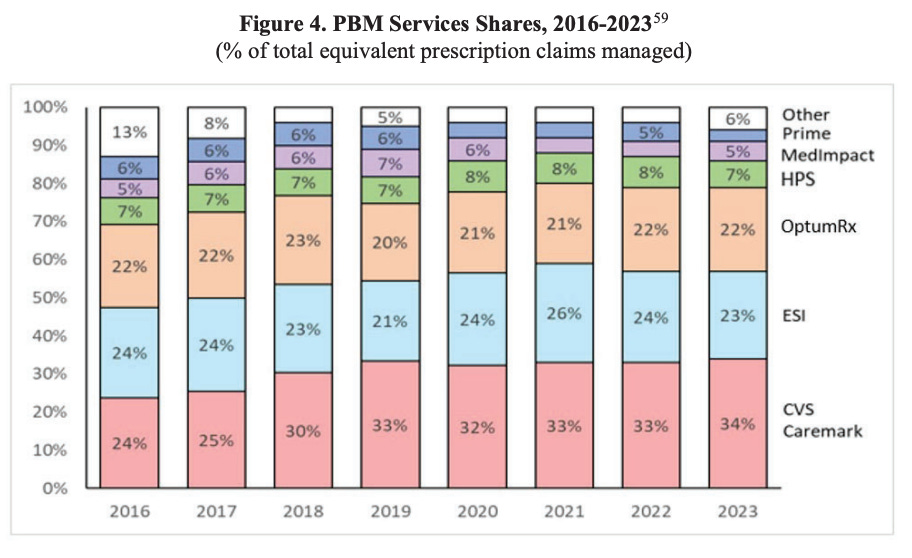
The PBM market is incredibly concentrated, with nearly 80% of prescription claims in 2023 being processed by just three companies: such as CVS Caremark (part of CVS Health), Express Scripts (part of Cigna), and OptumRx (part of UnitedHealth). As a result, PBMs hold tremendous market power.
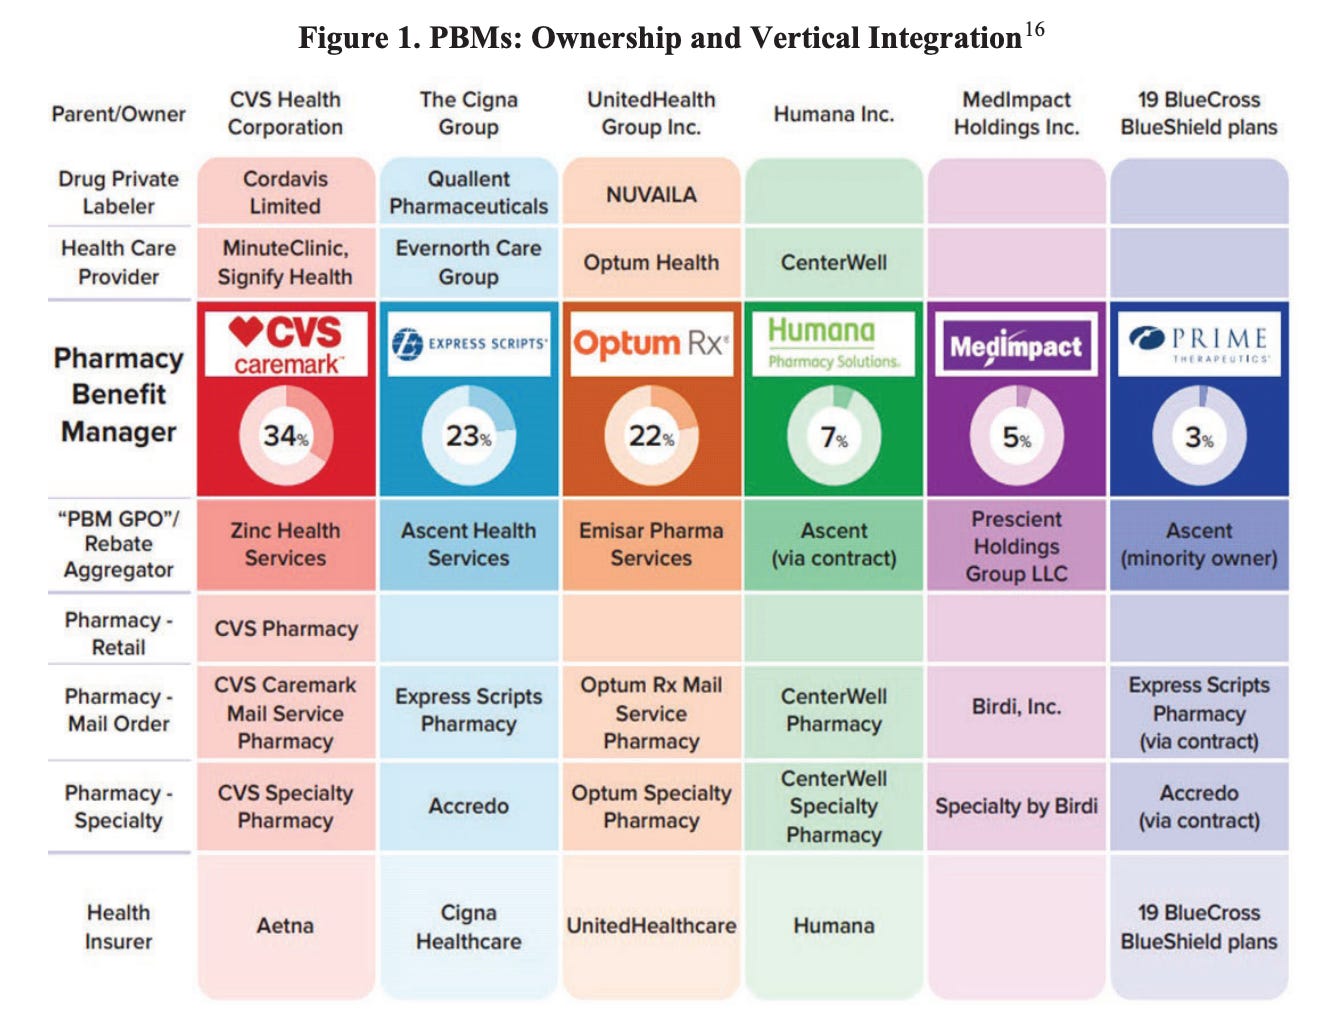
They are typically vertically integrated with insurers or pharmacies, including five of the six largest PBMs. This integration allows for stronger negotiation with drug manufacturers and PBMs to direct patients to their own pharmacies that also benefit from higher reimbursement rates. For example, for imatinib mesylate, commercial health plan reimbursements to affiliated pharmacies averaged roughly $2,700 per month in 2022, more than 40 times higher than the NADAC (retail community pharmacies acquisition cost) of $66.
Furthermore, fees only continue growing for providers and unaffiliated pharmacies with PBM’s fees doubling over the last 5 years by creating new fees.
PBMs are one of the primary drivers of rising drug prices, with rebates and fees accounting for 42% of every dollar spent on brand medicines. Although drug manufacturers set the prices, a big driver of these prices are PBM rebates, with a $1.17 increase in drug prices for every $1 increase in rebates.
The reason for this is that PBMs receive rebates as a percentage of drug list prices, incentivizing more expensive drugs to be placed on PBM formularies and thus incentivizing manufacturers to raise prices.
Major PBMs have also integrated upstream on the value chain by creating their own group purchasing organizations (GPOs) that negotiate drug savings through rebates from pharmaceutical manufacturers. However, the additional complexity this brings allows PBMs to increasingly justify higher fees by funneling new fees through GPOs.
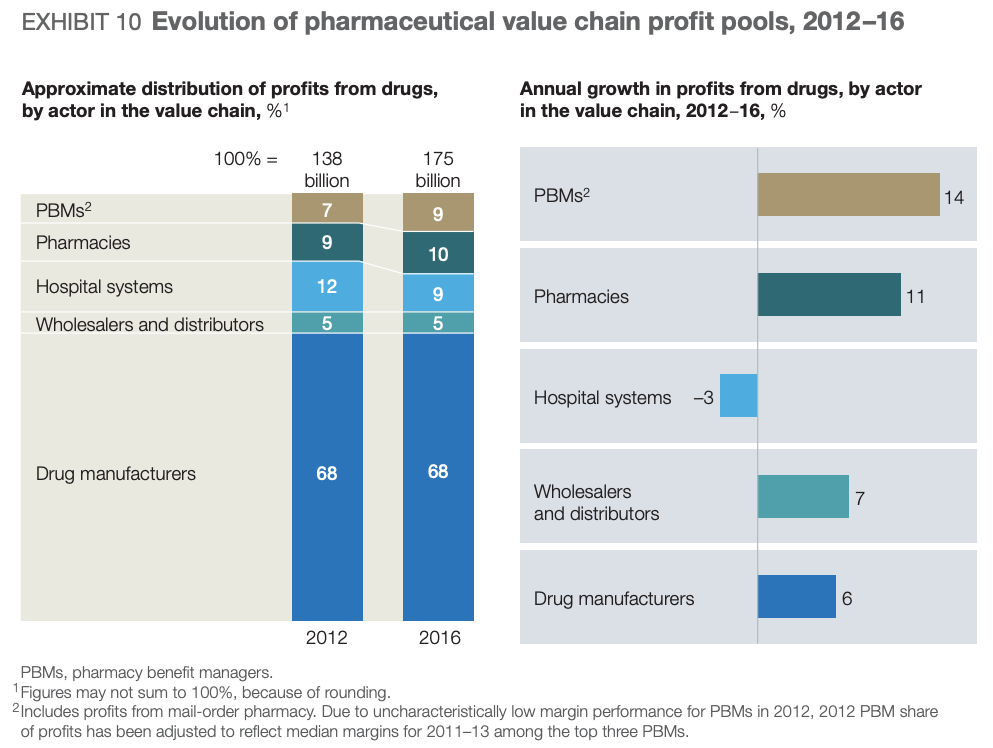
As a result, PBMs have been gaining share in the pharmaceutical value chain at hospital systems and independent pharmacies’ expense.
Key Takeaways
Payers Attractiveness: B Tier
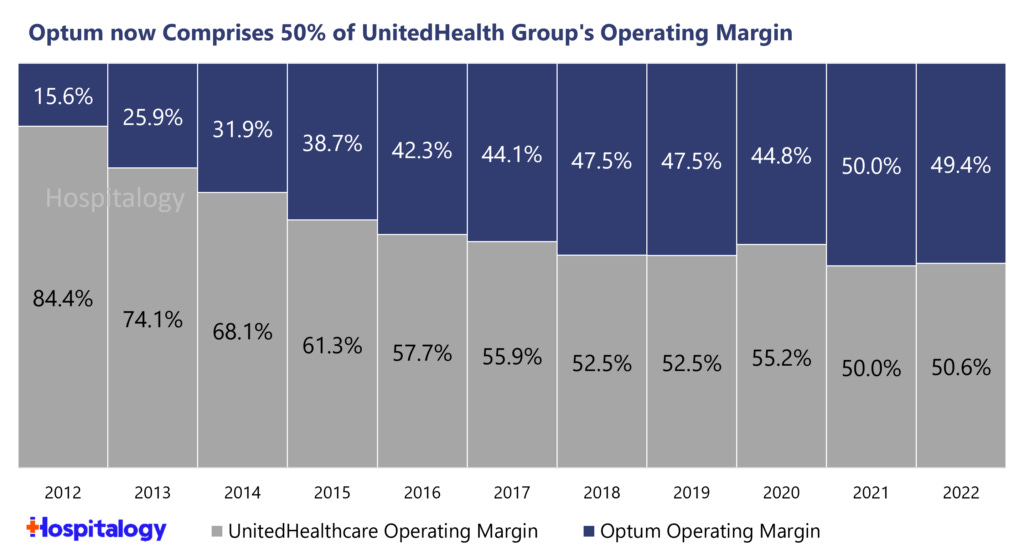
The largest commercial health insurers—UnitedHealth, Elevance Health, CVS Health (Aetna), and Cigna—are deeply involved in nearly every aspect of healthcare delivery in the US, from insurance coverage to pharmacy management, care coordination, and clinical services.
These businesses benefit from recurring payments for their health insurance plans, diverse business lines, and high barriers to scale.
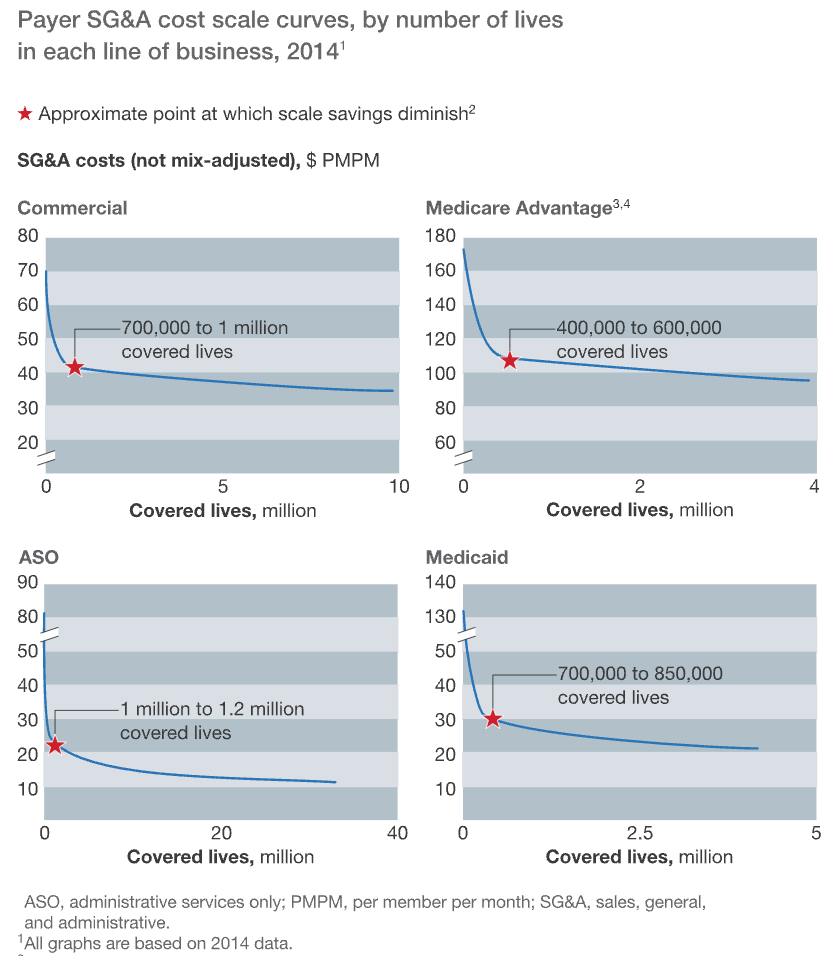
The charts below show the significant economies of scale that payers realize across each of their lines of business by covering more members. For example, Medicaid carriers with over 10 million covered lives achieve pretax margins that are more than double those of carriers covering between 2.5 and 5 million lives.
A Deloitte study found that in 2017, the top three health plans captured 80% of total industry underwriting profits and the top five plans boasted an average return on capital (a measure of how efficiently they use debt and equity investments to generate profits) that was almost double the rest.
It should therefore not be a surprise that payers have focused on maximizing scale through horizontal and vertical integration.
Through a prolific history of M&A, each of the four top health plans owns a PBM and provides health services in addition to offering health insurance. The benefits are obvious: eliminating costs, larger scale to negotiate costs with providers and producers, improved care delivery, cross-selling opportunities, and the ability to circumvent medical loss ratio requirements by shifting profits from the health insurance segment, which is capped and regulated, to the PBM segment, which is neither.
However, in practice, it has been difficult to implement and the CVS-Aetna and Cigna-Express Scripts mergers haven’t achieved the level of success that UnitedHealth has.
Consider CVS, which acquired Aetna in 2018 to expand into health insurance. The company has faced significant changes with integrating Aetna, leading to increasing operating losses in Aetna and a recent announcement that they are considering splitting up its assets.
Overall, while large payers are able to charge increased premiums to purchasers and pay lower reimbursement rates to providers as a function of their scale, they face constraints in doing so. For example, market concentration, specialty type, and geography all matter in providers’ ability to negotiate rates as I’ll expand on in the next section.
The best payers, such as UnitedHealth, established their leadership through astute M&A, operational efficiency, and scale economies, but lack the pricing power of the largest medical device or drug manufacturers.
Providers
Who are Providers?
Providers deliver medical services to patients, supplied by producers via distributors and reimbursed by payers.
Providers fall into two categories:
Health Systems
Pharmacies
As I’ll discuss in this section, the combination of being paid in a fee-for-service (FFS) model and the fact that the payers that pay for the care are not the patients that receive it is a major reason why the US healthcare system is inefficient.
Health Systems:
Health systems fall into three main categories, each with subcategories:
For-Profit Systems (36.1% of hospitals)
Large Chains (eg. HCA Healthcare, Universal Health Services, etc.)
Specialty-Focused Systems (eg. Acadia Healthcare for behavioral health)
Non-Profit Systems (49.2% of hospitals)
Faith-Based Networks (eg. Ascension Health, etc.)
Academic Health Systems (eg. Mayo Clinic, Cleveland Clinic, etc.)
Community-Based Systems (eg. Community Health Systems, etc.)
Government Systems (14.7% of hospitals)
Federal Hospitals (eg. Veterans Health Administration, etc.)
State Hospitals
Local Hospitals
Most health systems charge based on fee-for-service (FFS). They are reimbursed by payers for each individual service and negotiate separate rates for each service with private insurers while Medicare and Medicaid pay government-set rates. These government rates are set based on a base payment with adjustments for geography, the specific hospital, and the intensity of the services.
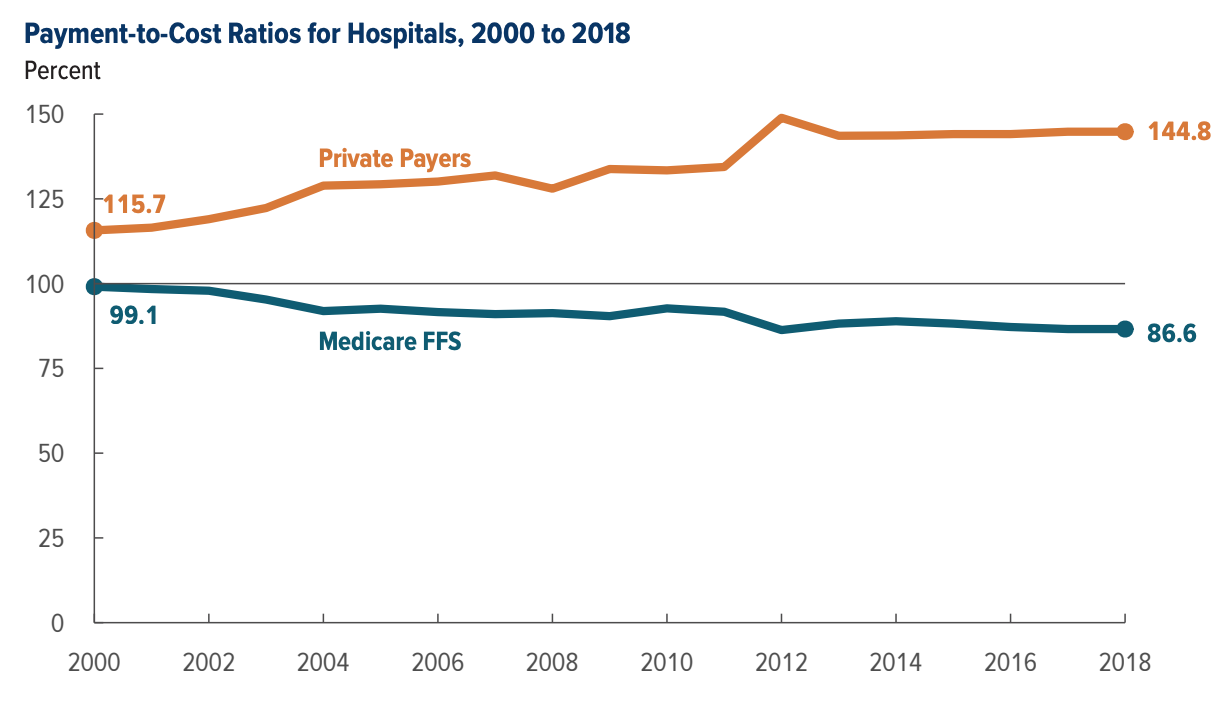
Because the government doesn’t negotiate on rates due to how much bargaining power they have, health systems typically lose money treating their patients. While Medicare/Medicaid form 74.2% of a health system’s actual costs, reimbursements only cover 87% of actual service costs.
However, the shortfall is narrowly made up for by high margins charged to private payers. Small insurers and the uninsured especially are forced to pay much higher prices.
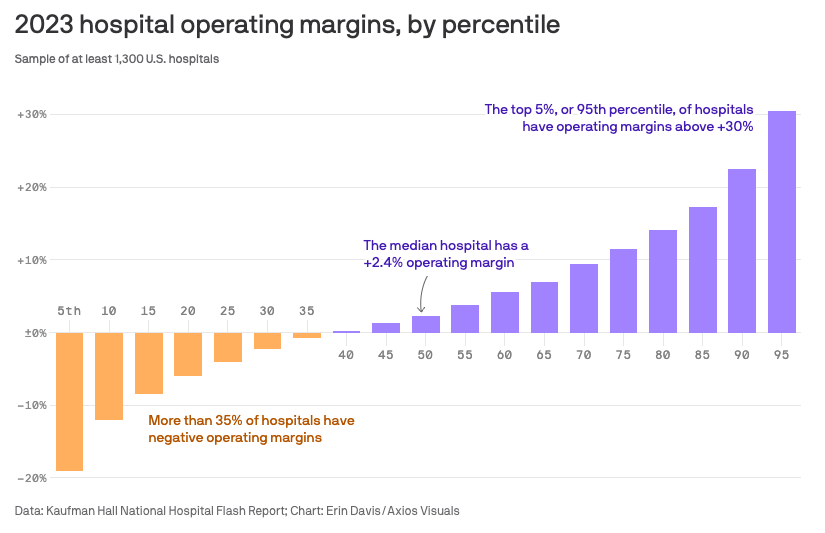
As a result, most health systems operate at razor-thin margins, with the median operating margin being 2.3% in 2023 and continuing to shrink over time due to falling reimbursement rates for Medicare, an increasing proportion of patients being Medicare as opposed to commercial, and increasing operational costs.
Some public health systems boast much stronger margins due to greater pressure to be efficient. Specialized health systems such as Acadia Healthcare also have specialized focuses on behavioural health, which have higher margins.
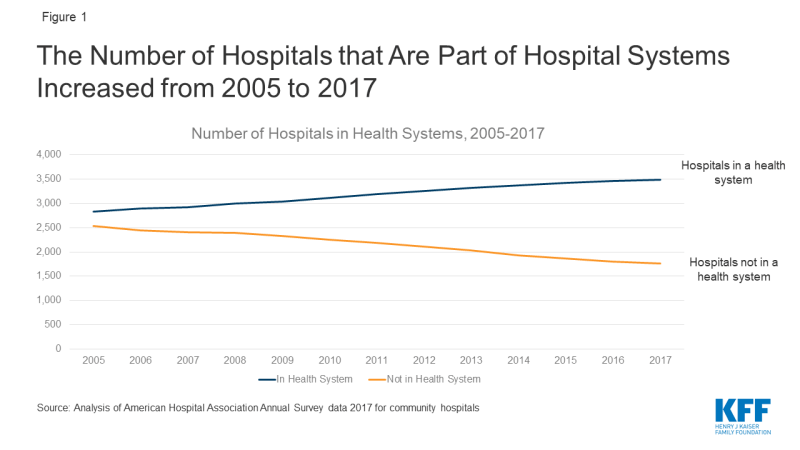
In an effort to improve margins, health systems look to consolidate and demand higher prices from payers. A 2016 McKinsey study found that on average, EBITDA margins at the top 40 US health systems were 17% higher than those at other health systems and 33% higher than those at independent hospitals. Furthermore, physicians in the most concentrated markets charge 14-30% higher fees than those in the least concentrated markets.
As a result, the number of independent hospitals has steadily declined, leading to higher prices.
These large healthcare systems also leverage electronic medical records (EMRs) to create barriers to entry by investing in their own systems. For example, Sutter Community Connect is an EMR offered at a low cost to independent doctors, but it directs those doctors to refer their patients to do tests and procedures at Sutter’s facilities by default.
Hospitals also may increase prices for reimbursable items while removing items that are rarely reimbursed, leading to widespread overcharging. Departments that traditionally lost money but were integral to providing patient care such as emergency rooms were also forced to restructure or close if they couldn’t become profitable.
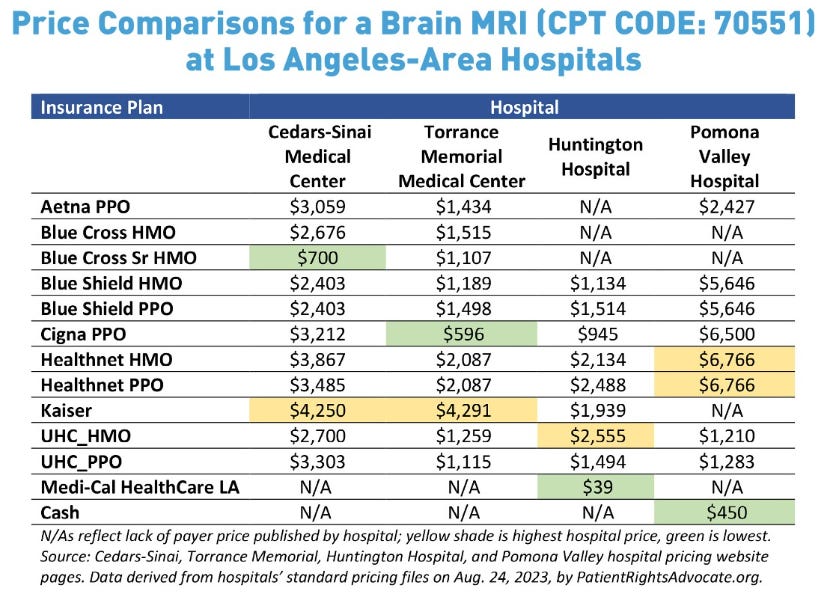
This all leads to significant discrepancies in medical procedure costs, even within the same city. This study by PatientsRightsAdvocate found prices can vary up by an average of 10x for the same procedure within the same hospital depending on a patient’s insurance plan!
The below chart shows the variance in costs for a brain MRI across hospitals in the LA area can vary from $39 to $6,766 depending on which hospital you go to and insurance plan you use!
Key Takeaways
Health Systems Attractiveness: D Tier
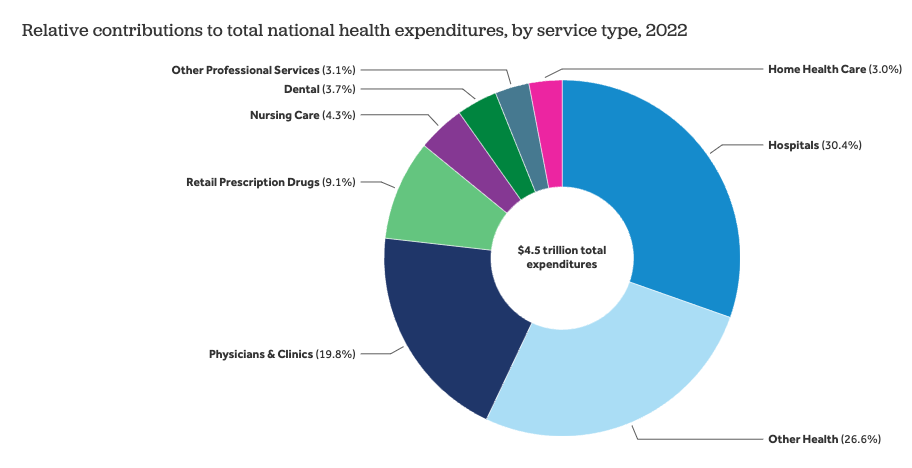
Spending on hospital care and physician services forms over half of overall healthcare spending in the US. The average cost of a day at the hospital in the US is $4,300, more than three times Australia, the next most expensive country.
However, this doesn’t make health systems good businesses to invest in. In fact, more than 35% of hospitals reported operating losses in 2023 and the trend is getting worse.
To break even by 2027, an average health system would require annual payment rate increases of 5–8%, double the growth rate seen over the past decade, according to BCG. If private insurers shoulder the entire burden, hospitals would need year-over-year increases of 10–16%.
Health systems’ greatest expense lies in labour costs, which form 63% of overall costs. In 2022, non-profit hospital CEOs made on average eight times more than their hourly employees, with major hospital CEOs making $3.1 million.
US physicians are also paid the most in the world and their salaries continue to grow. As of 2021, primary care doctors in the US were paid $316,000 per year, more than 72% higher than the second-highest country, Germany.
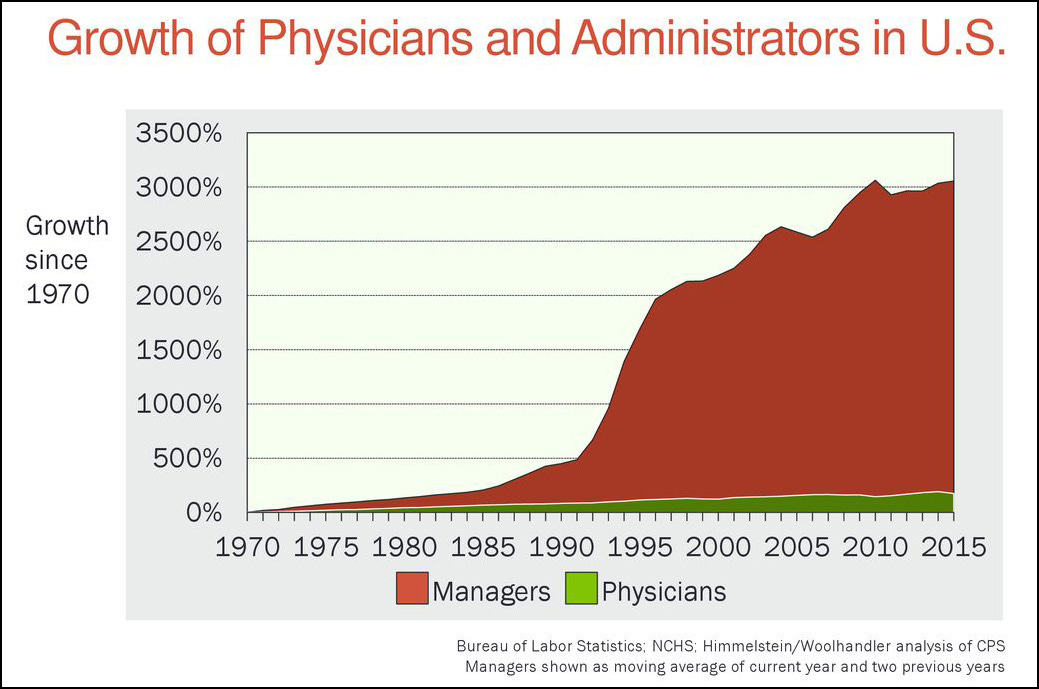
Administration is another major expense and the largest driver of wasteful spending. As I’ve described previously, mundane procedures such as billing are extremely complicated given the amount of middlemen. Each hospital must negotiate rates separately with multiple insurance companies, each of whom has various billing procedures and requirements.
The fee-for-service payment model also leads to wasteful procedures as hospitals and physicians are incentivized to bill as many procedures as they can and upcharge patients. This creates further administrative complexity, as nearly 15% of claims submitted to payers are initially denied.
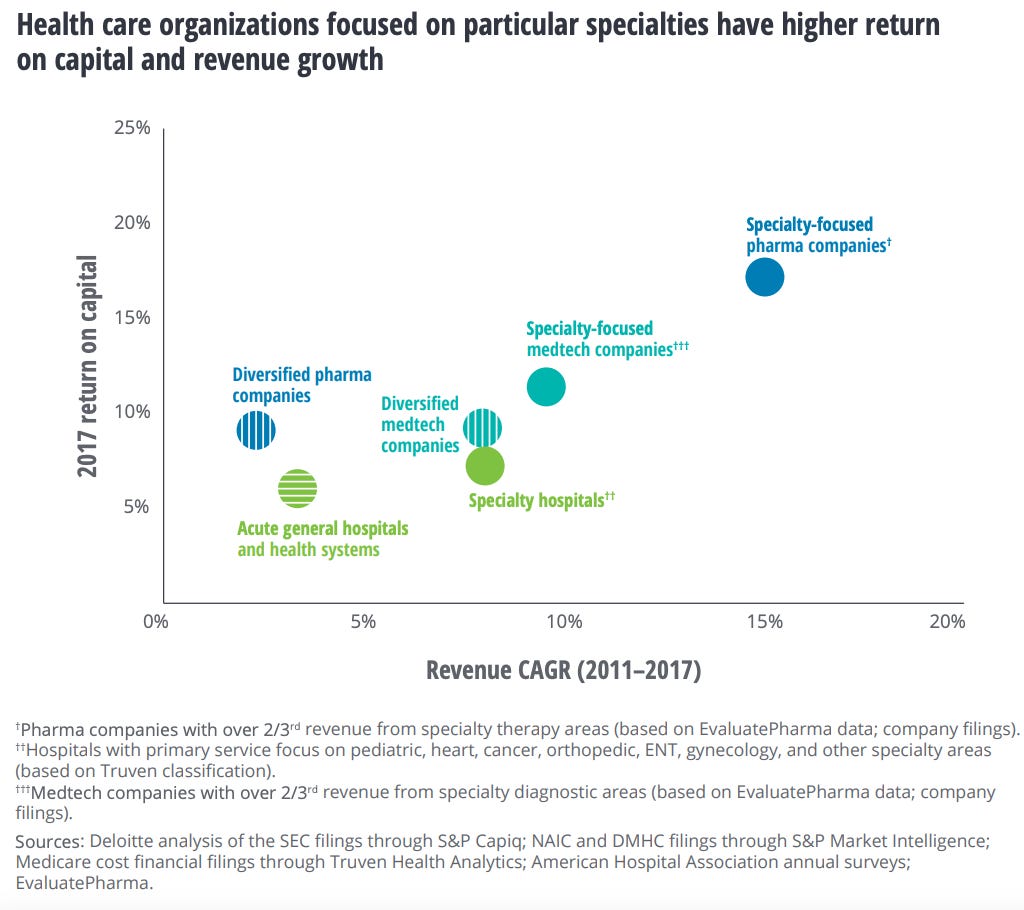
As a result, according to a 2017 Deloitte analysis of thousands of health systems, hospitals and health systems are the most capital-intensive organizations in the healthcare sector with the lowest returns on capital (ROC).
However, the same study found that hospitals that focused on specific conditions such as heart, cancer, and surgeries outperformed general acute care hospitals on both revenue growth and return on capital. Hospitals focused on surgery grew revenue the fastest between 2011 and 2017 and had the second-highest ROC after those focused on heart conditions.
I believe the success of these specialized hospitals again shows the waste inherent in most hospitals. Without the burden of unprofitable segments like emergency rooms and extensive equipment, and with streamlined and standardized processes, these hospitals are able to deliver better care at a lower cost.
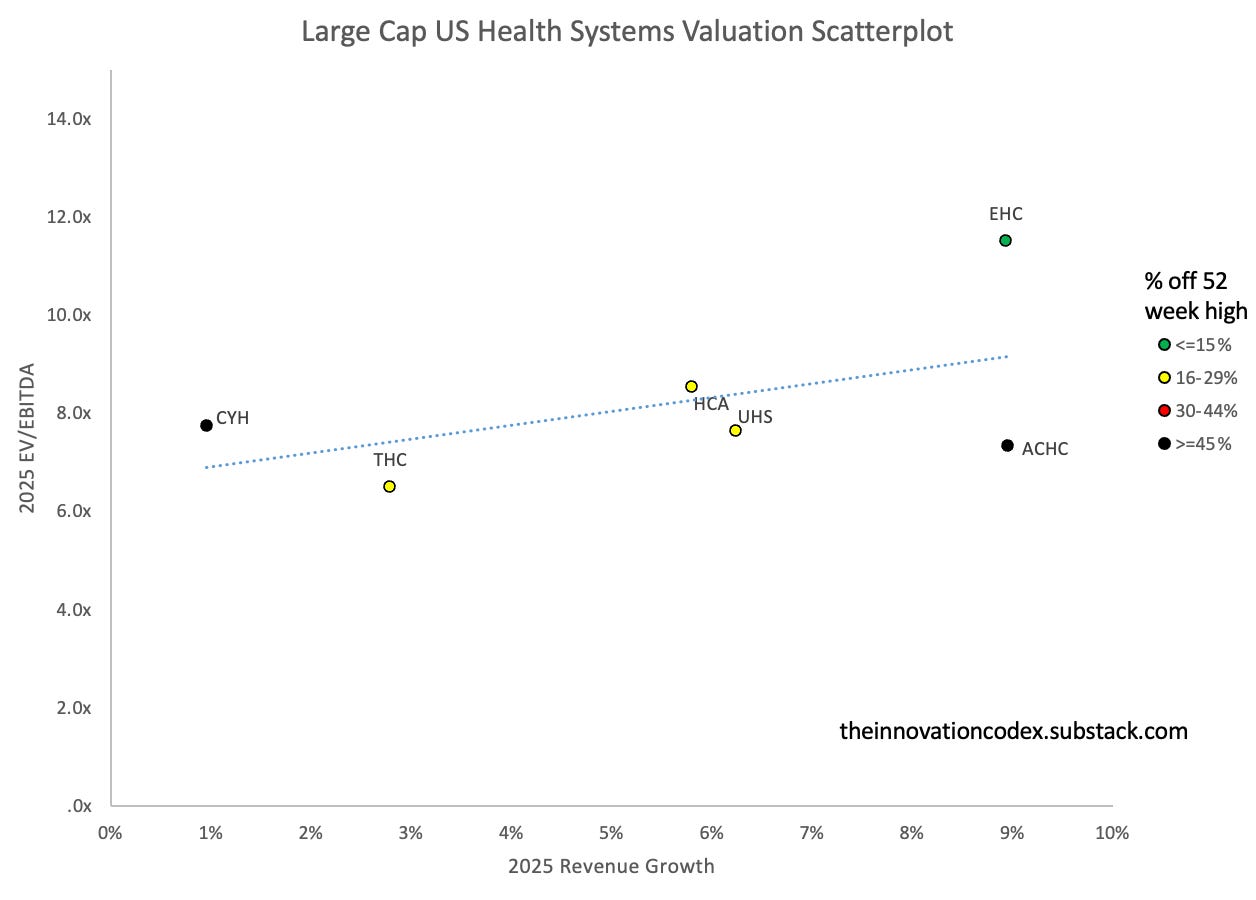
Overall, with health systems, consolidation and specialization win with the ROC of the top five largest health systems by revenue being double the ROC of the rest. As an example, HCA Healthcare is the largest for-profit health system in the US and has best-in-class margins and outperformed the market.
However, while consolidation and specialization have helped, with large or specialized hospital systems doing better than their independent unspecialized counterparts, they suffer from high and rising operational costs and are being squeezed on reimbursement rates by much more powerful payers.
Furthermore, as we’ll discuss later, the transition to value-based payment models, pushed by large payers such as Medicare, where outcomes are tied to the quality of care delivered, is also having a disruptive impact on hospital margins through lower revenues.
Pharmacies:
Pharmacies fall into three main categories, each with subcategories:
Retail Pharmacies
Chain Pharmacies (CVS, Walgreens, Rite Aid, etc.) - 54% market share
Retailers with Pharmacies (Kroger, Safeway, Walmart, Target) - 25% share
Independent Pharmacies - 21% share
Institutional Pharmacies
Hospital Pharmacies
Long-Term Care Pharmacies
Government Pharmacies
Specialty Pharmacies
Mail Order Pharmacies (eg. Amazon Pharmacy)
Compounding Pharmacies (create customized medications)
Specialty Pharmacies
The drug supply chain is quite complicated and there are several ways pharmacies make money.
The following graphic from The Prescription blog does a great job of showing the complex network of relationships in the pharmaceutical supply chain.
Pharmacies purchase drugs from wholesalers that negotiate bulk discounts with drug manufacturers and sell them at a markup to patients.
For insured customers, PBMs negotiate reimbursement rates with pharmacies for each drug. The reimbursement rate includes both a dispensing fee and a cost for the drug. However, the actual rate that PBMs pay pharmacies is not always the reimbursement rate. Rather, it is the lower of either the retail cash price that pharmacies set, the negotiated reimbursement rate, or the average wholesale price plus a markup. In practice, the PBM usually ends up paying pharmacies the negotiated rate but it means that pharmacies have to set their retail cash prices artificially high. Again, this results in uninsured patients paying the most.
Pharmacies typically have low EBITDA margins of ~4% and are much less powerful than health systems. For example, hospitals pay on average 9% less than retail pharmacies for top-selling outpatient drugs, and large HMOs that buy directly from manufacturers pay on average 20% less than retail pharmacies.
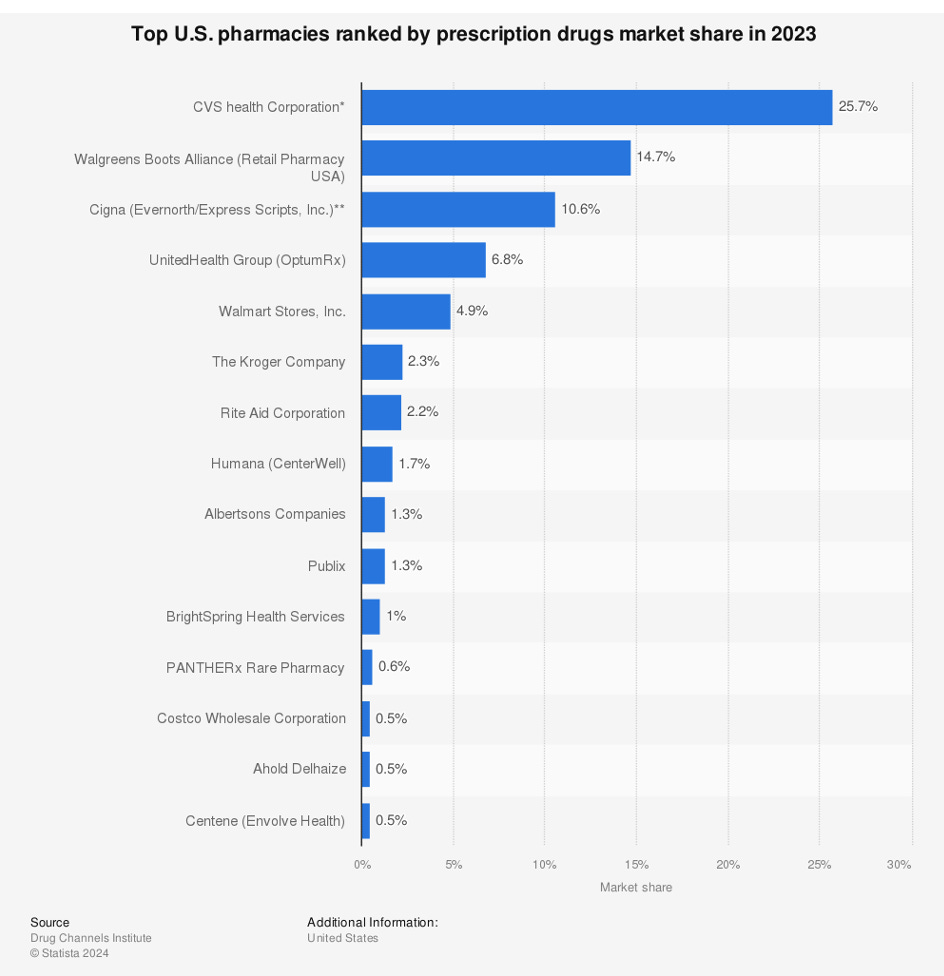
While pharmacies are quite concentrated with CVS Health having 25% market share, followed by Walgreens with 15%, and Express Scripts with 11%, their profit margins are stifled by the multiple middlemen like PBMs and wholesalers that take their share ahead of them.
Furthermore, health systems get discounts and rebates from manufacturers due to their ability to directly influence prescribing practices.
Key Takeaways
Pharmacies Attractiveness: D Tier
Pharmacies are fighting a losing battle against drug manufacturers and payers. Gross margins for independent pharmacies fell to 19.7% in 2024, representing its lowest level in the past 10 years and more than one independent pharmacy closes per day in the US.
Many small pharmacies are often presented with low-ball reimbursement rates below their acquisition costs by PBMs that they must accept or risk losing customers with that insurance.
PBMs also charge Direct and Indirect Remuneration Fees (DIR fees) to pharmacies that are assessed retroactively based on PBM-set performance metrics such as patient adherence or generic dispensing rates. These fees have historically caused many pharmacies to end up selling prescriptions at a loss and have grown 107,400% between 2010 and 2020.
The CMS recently prevented DIR fees from being charged retroactively, but while this improves transparency, it does not eliminate the core issue of these fees being charged. It also results in double-dipping, with new DIR fees being assessed at the point of sale, while 2023 DIR fee clawback are still being collected. As a result, 32% of independent pharmacies also considered closure in 2024.
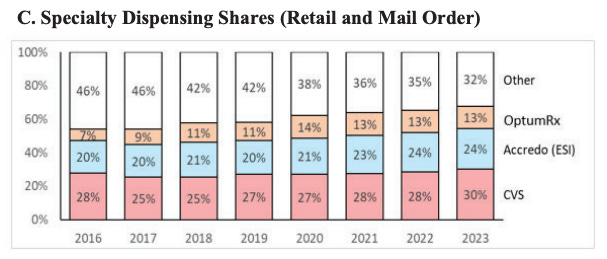
It should be no surprise that pharmacies have sought vertical integration with PBMs to gain an advantage. PBM-affiliated pharmacies have done better than independents and now account for nearly 70% of all specialty drug revenue.
Pharmacies, unless paired with PBMs, are in one of the worst competitive positions within the healthcare value chain. Over half of pharmacies are receiving below-cost reimbursements for 30% of prescriptions and lose money on over 60% of Medicare Part D prescriptions when including operating costs. This trend is also getting worse, with 99% of pharmacies reporting lower prescription reimbursements since January 1, 2024.
Furthermore, threats like the low-cost mail order pharmacies such as the Mark Cuban Cost Plus Drug Company and Amazon Pharmacy and prescription discount marketplaces such as GoodRx are further hurting pharmacy margins.
Distributors
Who are Distributors?
Distributors act as intermediaries between drug and medical device manufacturers and providers, leveraging their economies of scale to streamline the supply chain and lower prices. While they do take a cut, they play an important role by keeping prices in check, especially for smaller providers that would otherwise be forced to pay much higher prices.
Distributors fall into two categories:
Wholesalers (eg. McKesson, Cencora, Cardinal Health, etc.)
Group Purchasing Organizations (eg. Premier, Vizient, Ascent, etc.)
Wholesalers:
Wholesalers purchase drugs and medical supplies in bulk from manufacturers, storing these products in warehouses and distributing them to providers. They make money by charging manufacturers a percentage, typically 1% to 3%, of the wholesale acquisition cost, as well as charging providers higher prices and pocketing the spread. They also offer value-added services like data analytics and inventory management.
Wholesalers originally focused on streamlining the supply chain by consolidating large manufacturer orders and distributing to various smaller providers, but have since played an increasing role in leveraging their scale to negotiate discounts, typically ~16%, with the producers.
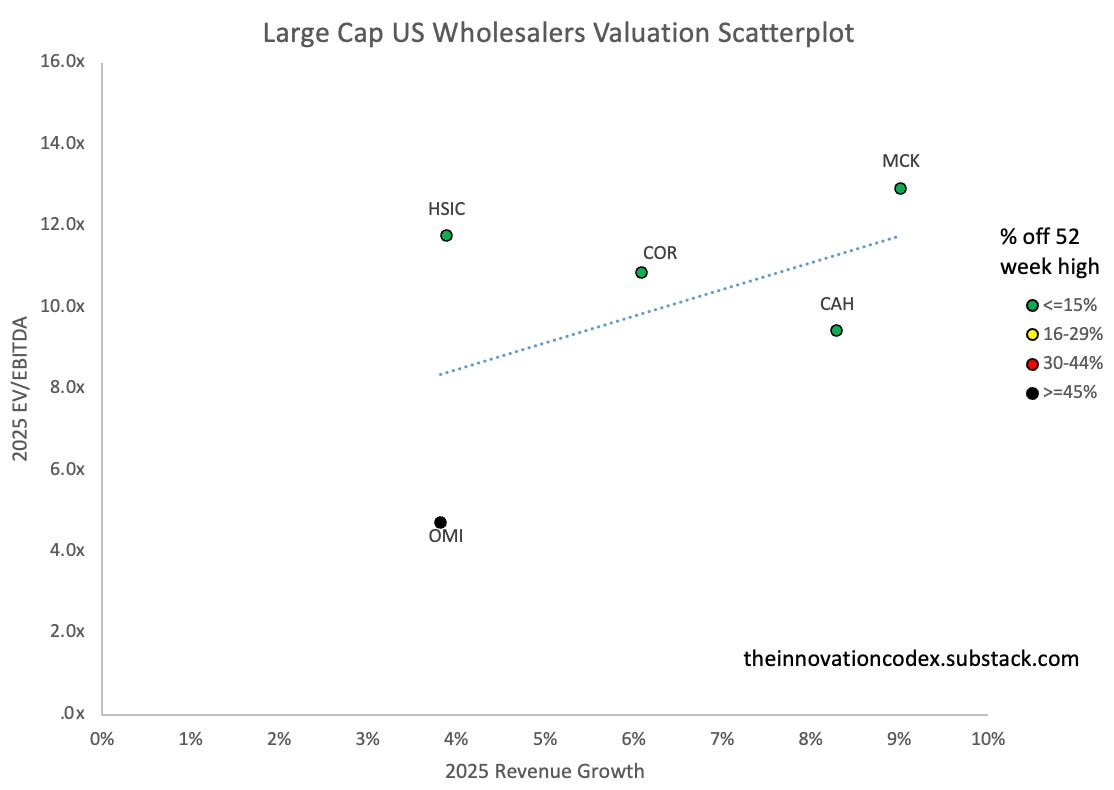
Today, McKesson, Cencora, and Cardinal Health have 92% market share of the pharmaceutical supply chain. Companies like Owns & Minor and Henry Schein also do the same for medical supplies.
Indicative of drug and medical device manufacturers’ power, profitability margins for the wholesalers are very low, with even the largest wholesaler, McKesson, only boasting 1.3% EBITDA margins.
Group Purchasing Organizations:
Group purchasing organizations (GPOs) like Premier form a similar role, operating on behalf of providers to negotiate prices with manufacturers and typically securing 10-18% discounts.
Unlike wholesalers, GPOs do not store inventory or handle distribution and are solely responsible for negotiation. GPOs make money off of administrative fees charged when a GPO member buys through the GPO contract and membership fees.
Key Takeaways
Distributors Attractiveness: C Tier
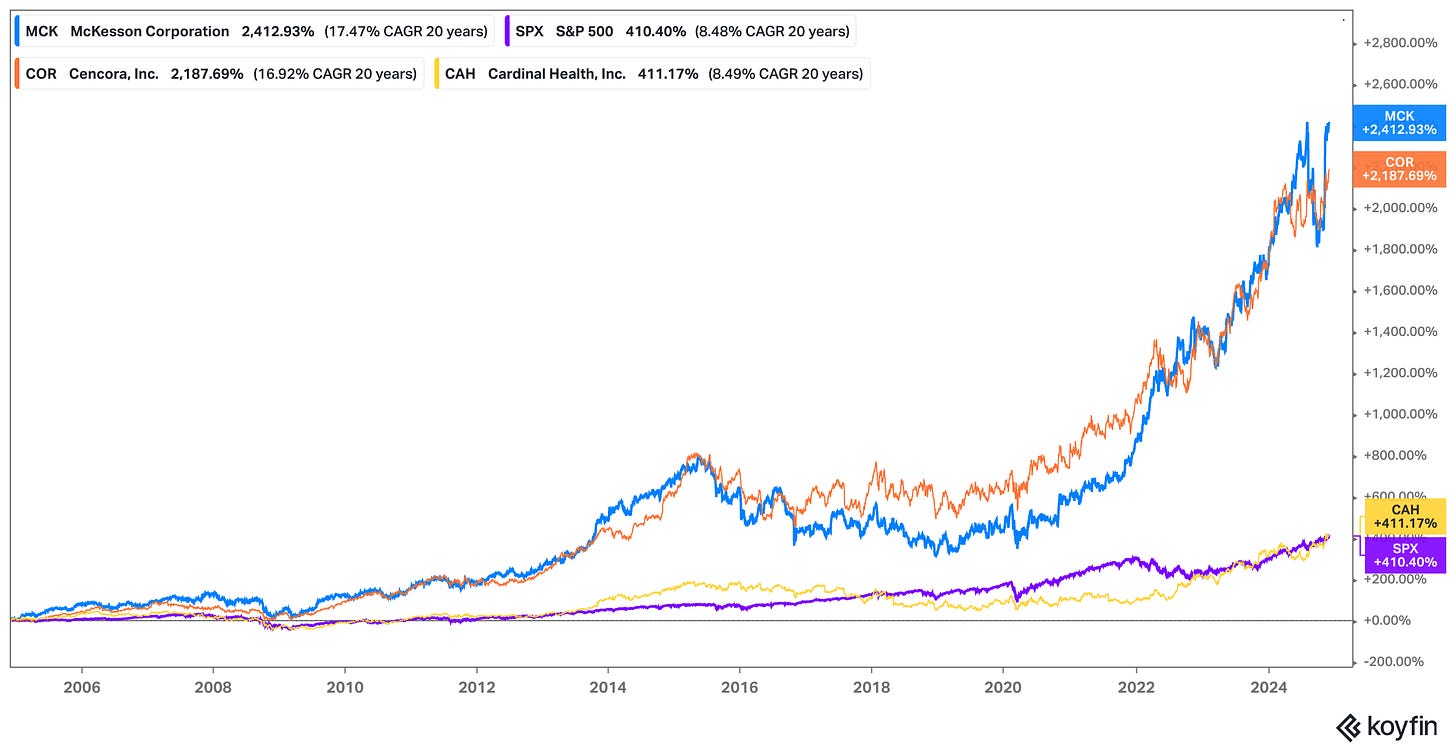
While distributors lack the power to significantly influence pricing for drugs and medical devices, the sheer scale of the wholesaler oligopoly has made them good investments historically.
In particular, McKesson and Cencora, the largest two pharmaceutical wholesalers, have significantly outperformed the S&P 500 index and their ROC continues to rise.
Due to their scale, they benefit from significant economies of scale, allowing them to operate very efficiently. They both also have a large presence in higher-margin specialty drug distribution and value-added services.
While the distributors aren’t as powerful as payers or producers in the value chain, they play an important role and have generated strong returns on capital through consolidation.
Producers
Who are Producers?
Producers collectively extract the most profits in the value chain. You can see this in the quantity, scale, and margins of these companies.
Eli Lily, known for its drugs for treating diabetes and depression, is the largest healthcare company in the world by market cap, which is currently at $710 billion.
Producers fall into two main categories:
Drug Manufacturers
Medical Device Manufacturers
Drug Manufacturers:
Drug manufacturers fall into several categories:
Big Pharma have broad and diverse portfolios and develop a significant percentage of new branded prescription drugs (eg. Johnson & Johnson, Pfizer, Merck)
Generic Drug Manufacturers produce cheaper versions of branded drugs after their patents expire (eg. Teva Pharmaceuticals, Sun Pharmaceuticals, Lupin Pharmaceuticals)
Biopharmaceutical or Biotech companies that specialize in developing drugs from biological sources (eg. Amgen, Gilead, Regeneron)
Contract Manufacturing Organizations that provide manufacturing services to other pharmaceutical firms (eg. Catalent, Lonza, Boehringer Ingelheim), charging based on a cost-plus model
Specialty Pharmaceutical Companies that make complex drugs for specific conditions (eg. Vertex Pharmaceuticals, Horizon Therapeutics, Jazz Pharmaceuticals)
Over-the-Counter Drug Manufacturers which produce medications that don’t require a prescription (eg. Sanofi Consumer Healthcare, Reckitt Benckiser)
Branded drug manufacturers capture the majority of the economics in the pharma industry. For instance, pharmacies earn a 43% gross margin on average for generics compared to just 3% for branded drugs. Generics are also typically 80-85% less expensive.
The driver behind this is the extensive 12-to-15-year drug development and approval process, which can be described in 5 steps:
Discovery and Development
Pre Clinical Research - testing candidates on animals
Clinical Research
Submitting an Investigational New Drug Application to FDA to begin testing on humans
Phase I: Small-scale safety testing (several months, 61% pass)
Phase II: Small-scale efficacy and side effect testing (Up to 2 years, 38% pass)
Phase III: Large-scale efficacy and side effect testing (1 to 4 years, 63% pass)
FDA Review - submitting a New Drug Application to FDA
Post-Market Safety Monitoring - Phase IV trials to monitor long-term efficacy and safety
The entire clinical trial process, from initial discovery to full approval, typically takes an average of 10 years, with the clinical trial stages accounting for 6 to 7 years of that time.
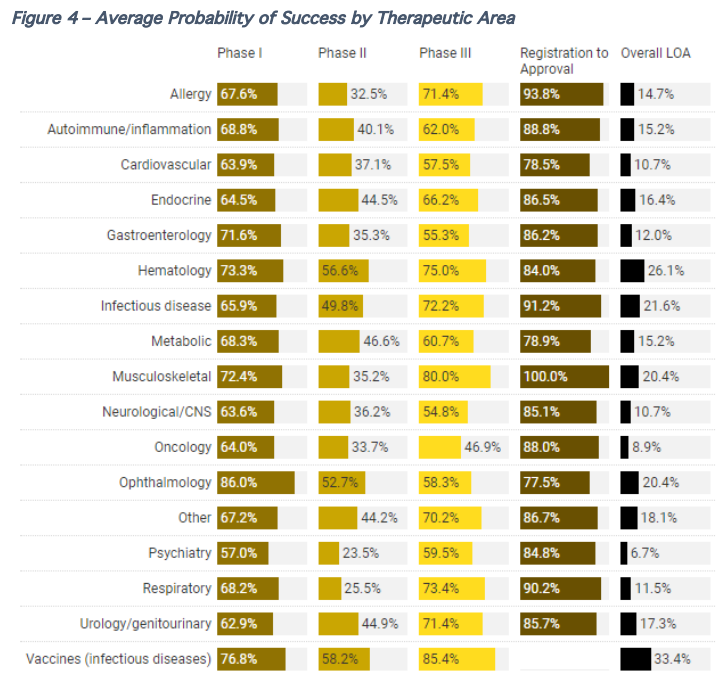
Certain therapeutic areas have a higher likelihood of approval (LOA). The chart below shows approval rate data between 1993 to 2015:
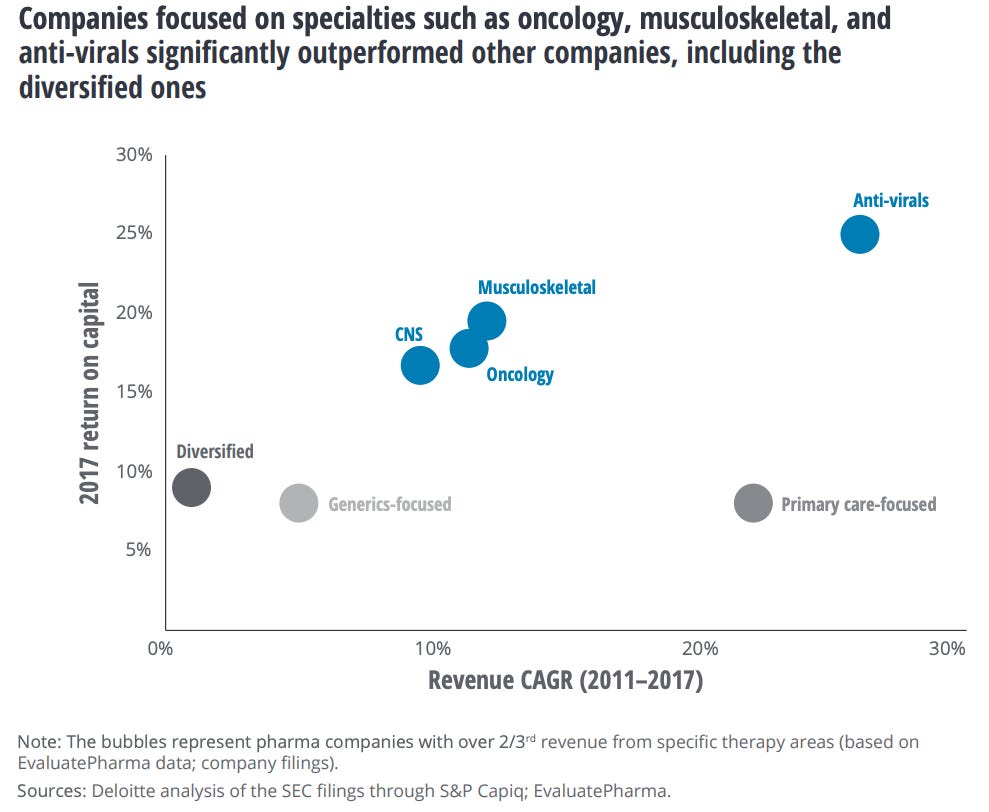
However, although oncology drugs had the second-lowest overall approval rates, companies that focused on oncology drugs earned higher returns on capital and had a higher revenue CAGR on average than diversified companies. Companies that focused on anti-virals boasted the highest returns and growth.
Consider the following takeaways on the drug development process:
The chances of success in Phase I, Phase II, Phase III, and from Registration to Approval are 61%, 38%, 63%, and 89% respectively, for 13% overall
Phase II to Phase III had the lowest probability of success because it is the first stage during which efficacy is assessed
Approval rates for therapeutic areas need to put in context of market sizes - although oncology drugs have lower approval rates, on average, companies focused on oncology drugs have outperformed
The lead indication (the primary medical condition that a drug targets) generally performed better than all indications across most clinical phases
The total cost of developing a new drug, including failures, is estimated at over $2.5 billion.
Due to patent protection from well-intentioned but poorly implemented regulations, market-driven pricing, and the significant number of middlemen, prescription drugs in the US are 2.78 times higher on average than 33 other high-income countries and account for 9% of all healthcare spending. Branded drugs especially are 4.22 times higher and drug companies generate 62% of their worldwide sales from the US market, even though the US only accounts for 24% of volume.
In 1984, the Hatch-Waxman Act allowed generic drugs to use prior clinical data from branded drugs, allowing for improved generic access. However, it sought to balance this by allowing brand manufacturers new ways to extend patents which led to extensive patent disputes and extensions. This practice, dubbed “evergreening”, led to widespread patent extensions and plays a major part in pushing up drug costs.
One example of this was the branded drug Asacol which was set to lose patent protection in 2013. However, in 2009, a different drug manufacturer acquired the rights to the drug and introduced two new versions of the generic: a once-a-day long-acting and a gel-coated version, with the original branded drug removed from the market. As a result, the drug continued to increase in price, reaching $800 a month in Florida compared to $12 a month in the UK for the generic. Other successful cases include Claritin to Clarinex and Prilosec to Nexium by manipulating the molecular entities.
Despite increasing drug costs, the FDA has continued to make it easier for branded drug companies to thrive. After a 1997 ruling by the FDA, the US is also now the only country besides New Zealand to allow drug advertising, which today is a $13B annual industry and another contributor to rising drug costs.
And lastly, in 2012, the FDA estimated the Breakthrough Therapy Designation (BTD) which allowed for 30% shorter clinical development times for drugs that treated serious conditions and showed substantial improvement over existing therapies. Securing this designation has been a big deal for companies, as it increases the chances of approval to 39% and as a consequence, improves the chances of attaining funding by 64%.
Key Takeaways
Drug Manufacturers Attractiveness: A Tier
Drug manufacturers can be a very rewarding sector to invest in for the same reason why they can be a risky sector to invest in: the very long and expensive drug development and approval process.
Indeed, branded drug manufacturers boast the highest margins in the healthcare industry, with average gross margins of 80% and EBITDA margins of 30-40%, and are largely recession-resistant. However, generics have less than half the margins due to losing patent protection and competing on efficiency and volumes instead.
Within branded manufacturers, returns on capital of those focused on specialties averaged 17%, outpacing the rest at 9% according to a 2017 Deloitte study, along with maintaining a 15% revenue CAGR between 2011 and 2017, outpacing diversified companies at 2%.
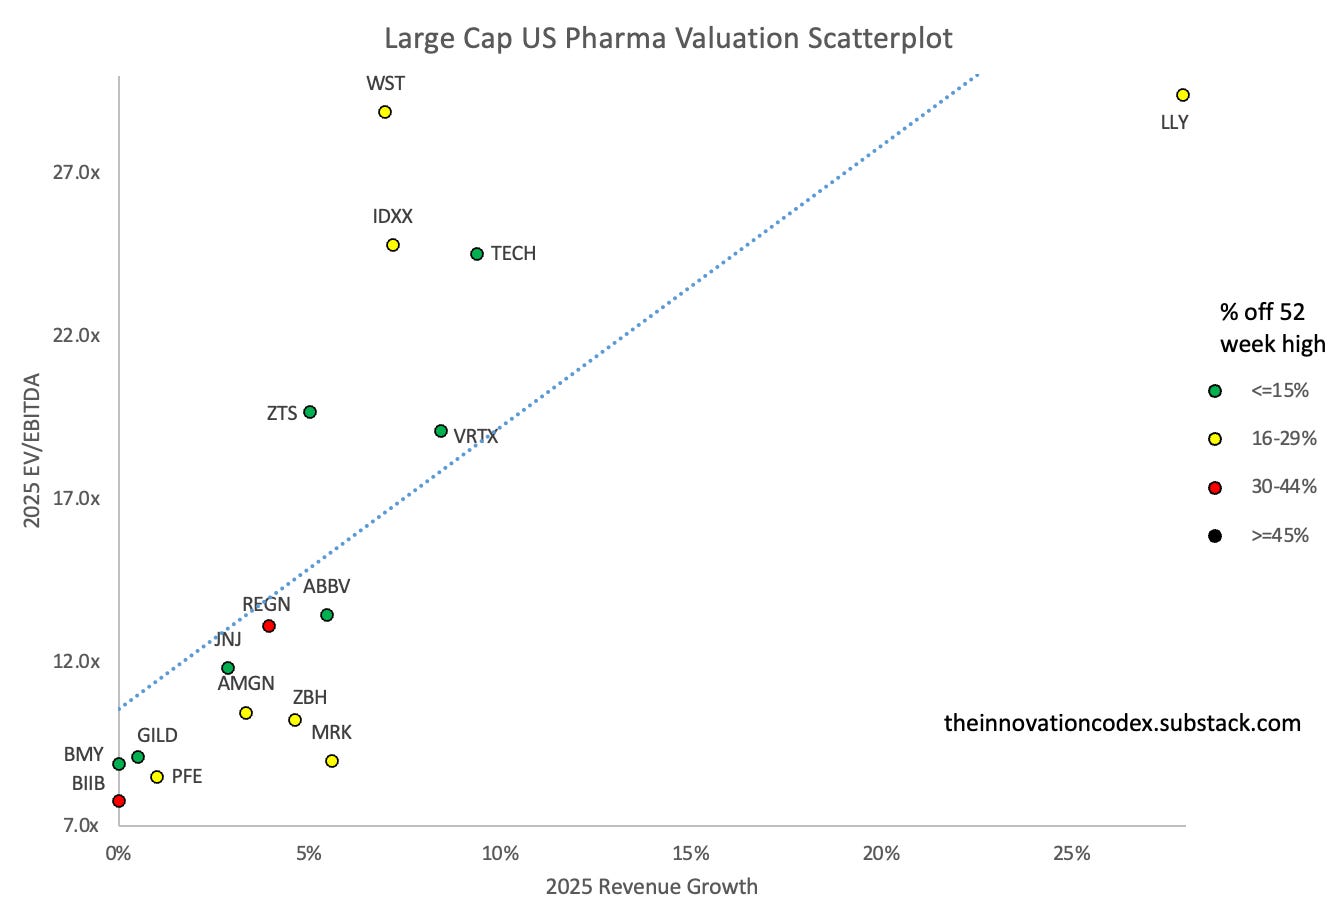
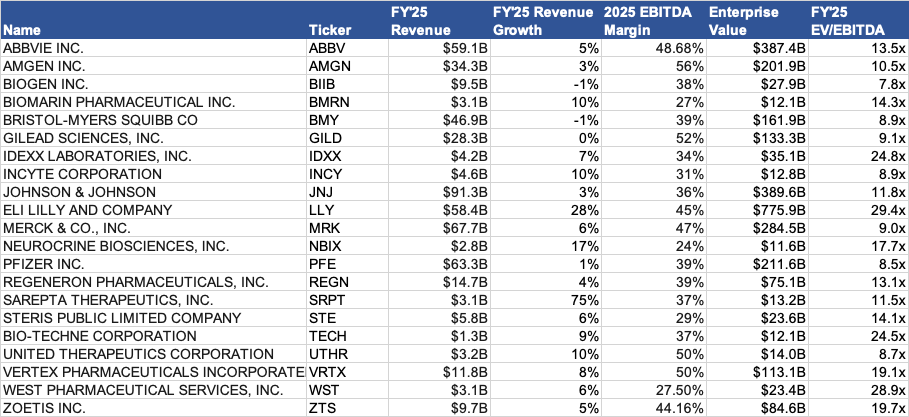
Of the top 4 best-performing healthcare stocks over the last 20 years, three are pharmaceutical companies: Regeneron Pharmaceuticals, West Pharmaceutical Services, and Vertex Pharmaceuticals. Regeneron and Vertex are massive specialty drug manufacturers that dominate their niches with high pricing power, while West manufactures packaging and delivery systems for injectable drugs and benefited from a low starting valuation.
Although more competition is coming in at the generic level, with estimated mid-single-digit annual price erosion estimated by S&P Global, branded drug manufacturers continue to benefit from patent protection and high drug prices in the US, driven by a fragmented payer system and relaxed regulations.
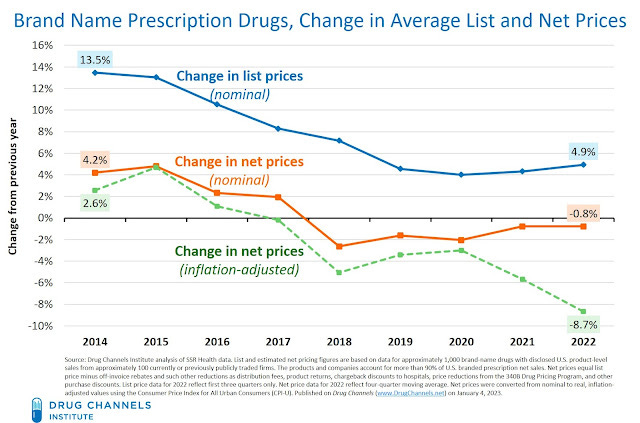
This has allowed them to continue to raise prices, though to a decreasing extent, with prices actually falling in real terms in recent years. This is driven by increased regulatory pressure, increased PBM power, and growing generic competition.
While the pharma industry spends more on federal lobbying than any other industry, regulation has been slowly catching up. The Inflation Reduction Act was the most substantial change to US healthcare since the ACA, allowing Medicare to start price negotiations on a handful of drugs, which is expected to reduce drug prices by 38% to 79% for Part D beneficiaries. However, I expect its impact to be relatively muted in the near term as many of the drugs selected are already near patent expiration and already discounted through rebates.
The regulatory environment has tightened overseas though. In 2022, Germany passed a regulation that capped prices for new medicines to the price of comparable patent-protected drugs on the market if they only offer minor additional benefits, which accounts for two-thirds of new drugs. As a result, Bristol Myers Squibb scrapped the launch of its new cancer drug Opdualag in Germany. European Parliament has also approved the proposal to reduce the standard minimum of 10 years data and market exclusivity to 9.5 years.
Patent cliffs (the sharp drop in profits when a patent expires) remain another large risk to established branded drug companies, with $180 billion in sales at risk through 2028 for the top 20 pharma companies. However, as I touched on previously, pharma companies have been great at extending patents by reformulating existing drugs through alternating the delivery method (tablet, time-release, injectable, etc.), switching to new indications, or alternating the molecular entity.
Medical Device Companies:
Medical devices often represent the most expensive part of a medical bill. Medical Device Manufacturers range from large companies like Abbott and Johnson & Johnson that have broad portfolios and global distribution to specialized companies like Stryker or Boston Scientific that focus on specific conditions.
In both cases, medical device manufacturers tend towards oligopolies and monopolies, with large, global medical device manufacturers dominating the industry. The top 1% of medical device firms accounted for 82% of total assets in a CRS study.
For example, Stryker, Zimmer Biomet, DePuy Synthes, and Smith & Nephew make virtually all knee and hip implants available in the US. DexCom, Abbott, and Medtronic make virtually all the continuous glucose monitors for diabetics. Intuitive Surgical maintained a monopoly in the surgical robotics space for over 15 years.
There is no standard process for medical device approval as it depends on the type of device, split into three classes:
Class I: Low-Risk Devices - eg. bandages, gloves, etc. (47% of devices)
Class II: Moderate-Risk Devices - eg. pregnancy test kits, Apple Watch, etc. (43% of devices)
Class III: High-Risk Devices - eg. implantable pacemakers, heart valves, etc. (10% of devices)
Almost all Class I devices don’t require FDA approval and must simply be listed with the FDA, pay a registration fee (~$7,600), and comply with general controls.
Class III devices require a premarket approval (PMA) application involving extensive testing with preclinical testing, three phases of clinical trials, and comprehensive data on safety on efficacy. PMA applications take 243 days to approve once submitted.
However, most Class II devices only require a 510(k) submission which allows for a much quicker pathway to approval with an average clearance time of only 177 days and is much cheaper, with standard application fees of ~$20,000 vs ~$480,000 for the PMA applications.
The catch with leveraging the 510(k) pathway is that the device must be similar to existing devices. Many companies take advantage of the vague standard and exploit the faster pathway for devices that should really be Class III. This has led to medical devices receiving generally less scrutiny today than most new drugs.
Key Takeaways
Medical Device Attractiveness: S Tier
Medical device companies benefit from much of the same factors that make drug manufacturers a good investment - strong pricing power, being recession-resistant, established physician preferences, and patent protection - but have a number of advantages that make them even better investments.
Faster Time to Market - Medical devices are faster to develop. From ideation to market approval, the development process can be as little as a week for Class I devices to 3 to 7 years for Class II and III devices. Whereas for drugs, 10 years is the average.
Higher Approval Rates - Devices are also much more likely to be approved. Class III devices that submit a PMA have an 8 in 10 chance of approval and 510(k) approval rates are even higher, compared to a less than 13% approval rate for drugs.
Cheaper to Develop: As a result of faster time to market and higher approvals, medical devices are also much cheaper to develop. Class II devices cost $30 million on average, whereas Class III devices cost $94 million, compared to an average of over $2 billion for new drugs. On average, major medical device companies spend between 5 and 15% of revenues on R&D, compared to pharma manufacturers at 15%.
Less Regulated - Finally, unlike the pharma industry which has seen a litany of new regulations constraining its pricing power in recent years, the medical device sector remains relatively less regulated. There are no wholesale prices and costs are determined after intermediaries negotiate their cut; as a result, pricing varies greatly as the table below shows, making it difficult to negotiate.
One drawback of medical devices is that they aren’t usually as profitable as blockbuster drugs as most are replaced by a newer version every 18 to 24 months. Patents are also broader and easier to circumvent. Furthermore, the fact that health system procurement experts now make decisions on medical devices as opposed to physicians has resulted in higher pricing pressure for non-essential, unspecialized device manufacturers.
However, these drawbacks are alleviated for the most advanced, specialized medical devices, such as implantable medical devices, which make up a significant portion of profits for large medical device manufacturers.
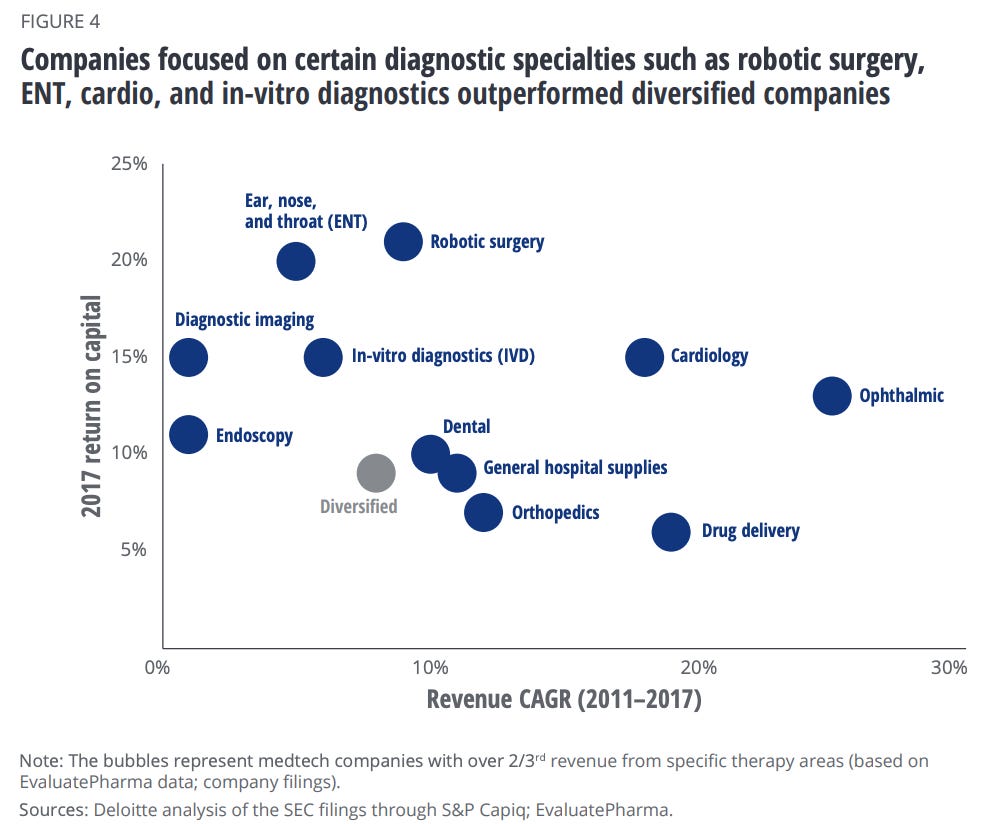
Indeed, a study using financial data on medtech companies from 2011 to 2017 found that specialized companies outperformed diversified companies and generated higher returns on capital (more efficiently used debt and equity investments to generate profits).
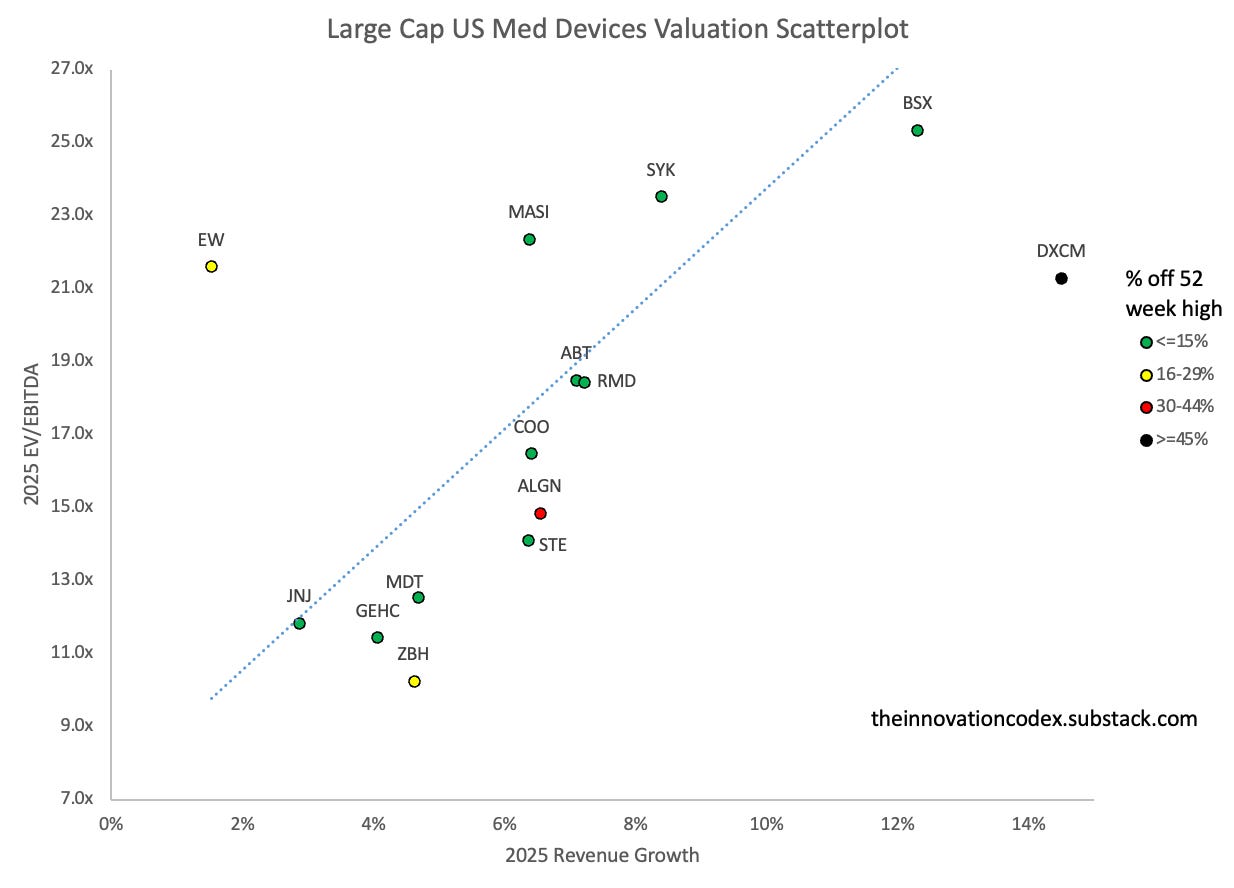
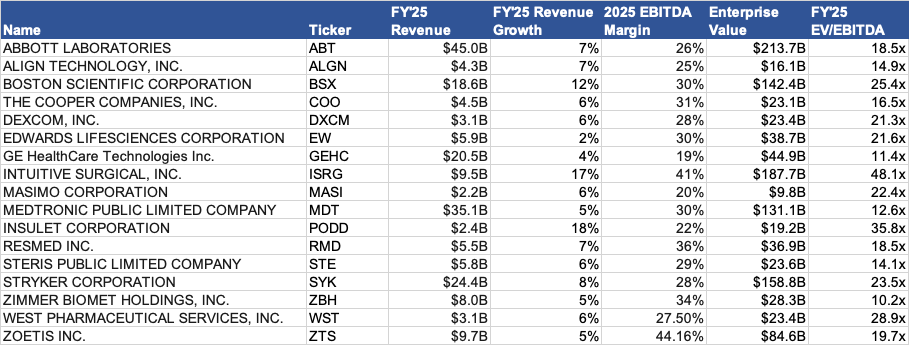
Overall, given the higher predictability and ROI of medical devices, while still enjoying many of the barriers to entry that drugs do, I believe established specialty-focused medical device manufacturers are among the most attractive to invest in within healthcare.
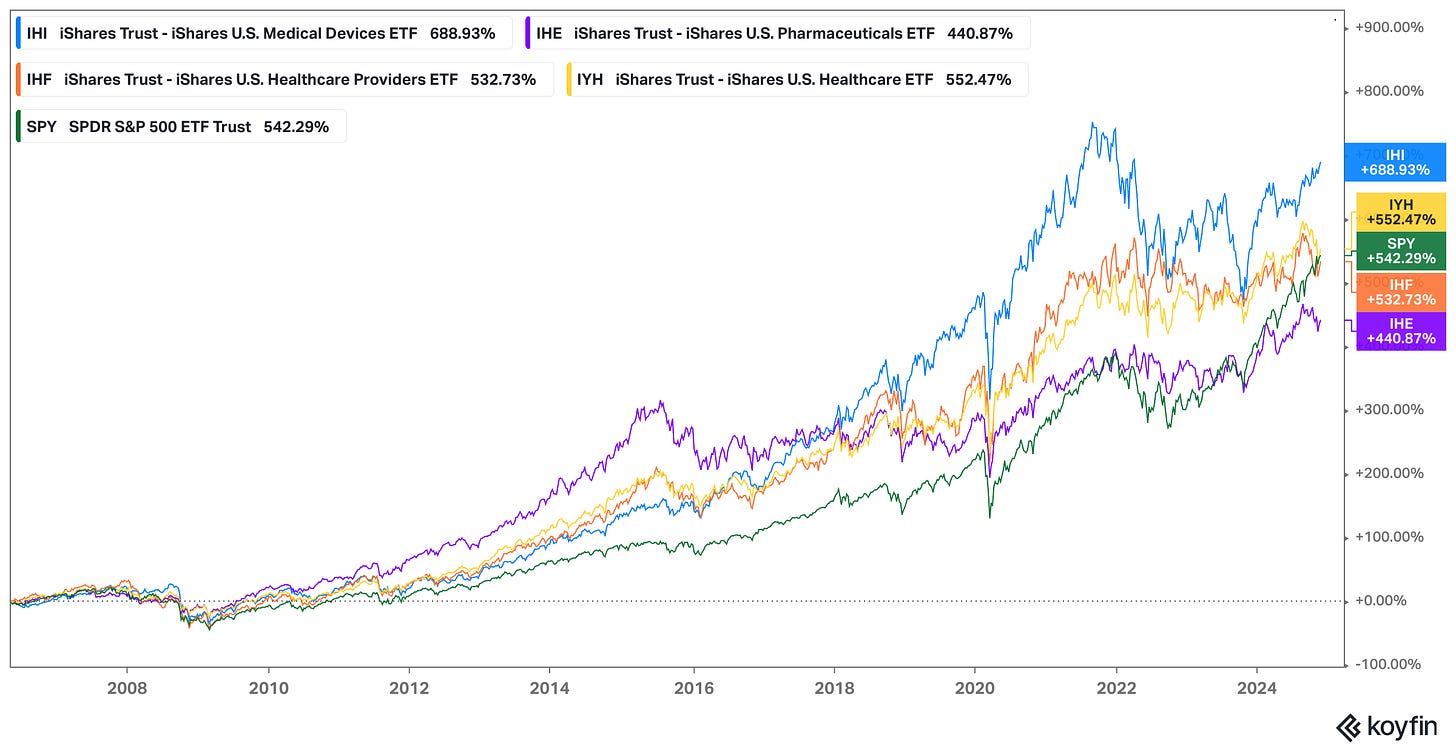
Indeed, when you compare the performance of sector-specific ETFs over the last 20 years, the results are clear:
US Medical Devices - 688.93% return
Broad US Healthcare ETF - 552.47% return
S&P 500 ETF - 542.29% return
US Healthcare Providers ETF - 532.73% return (mostly large health insurers)
US Pharmaceuticals ETF - 440.87% return
Medical devices not only significantly outperform the healthcare sector but also the S&P 500.
The best-performing healthcare stock of all time is medical device company Abbott Laboratories, which has earned a 7,803,730% cumulative return from 1937 to 2023, or 13.85% annualized, turning a $100 investment into nearly $8 million.
Furthermore, the best-performing healthcare stock by a wide margin over the last 20 years is robotic surgery pioneer Intuitive Surgical, earning an 18,221% return through 2023. It is also the 4th best-performing S&P 500 stock over the same period, behind only Nvidia, Monster Energy, and Apple.
Value Chain Analysis Takeaways
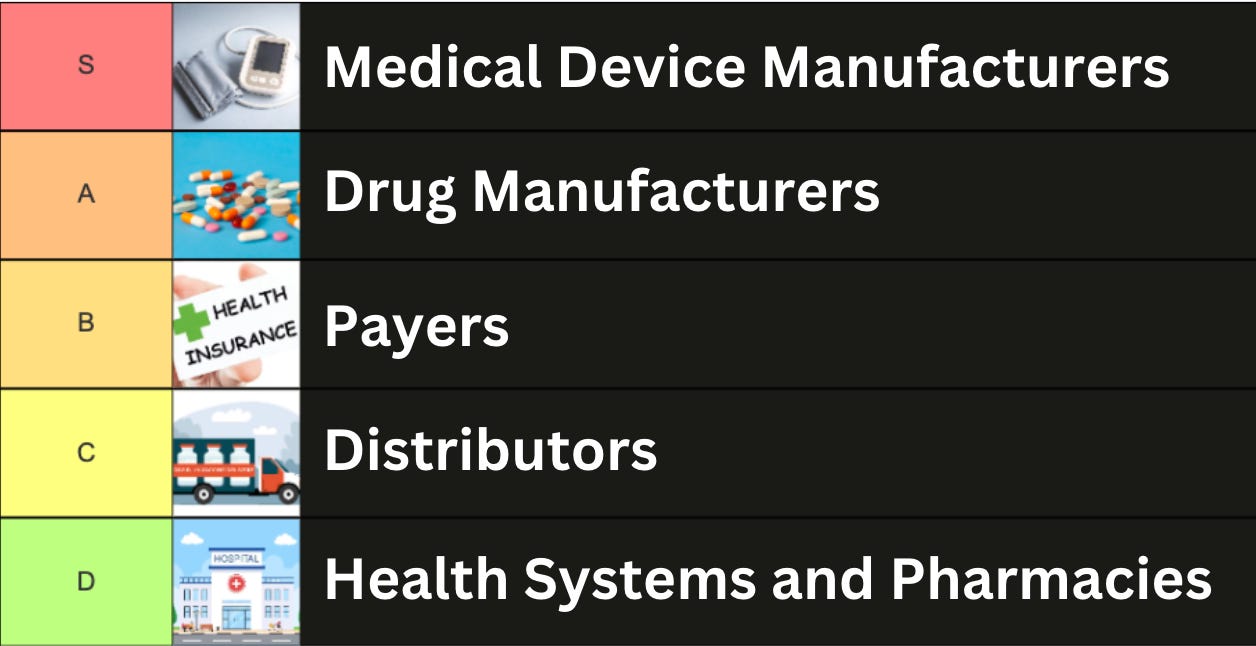
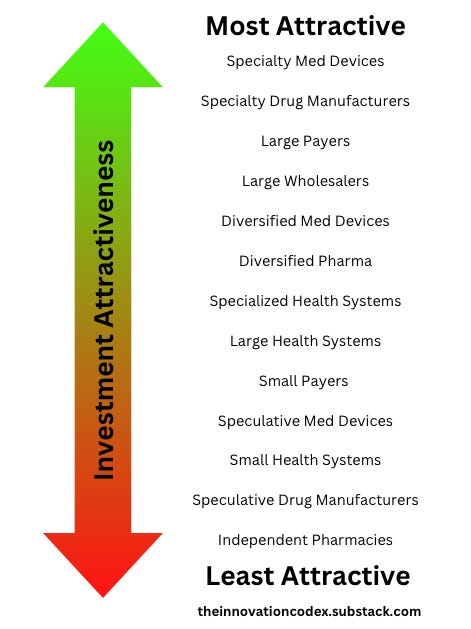
The following is a ranking of my view of the bargaining power and investment attractiveness that each part of the value chain holds based on the takeaways I’ve shared thus far.
However, the attractiveness of individual investments within each category is more nuanced.
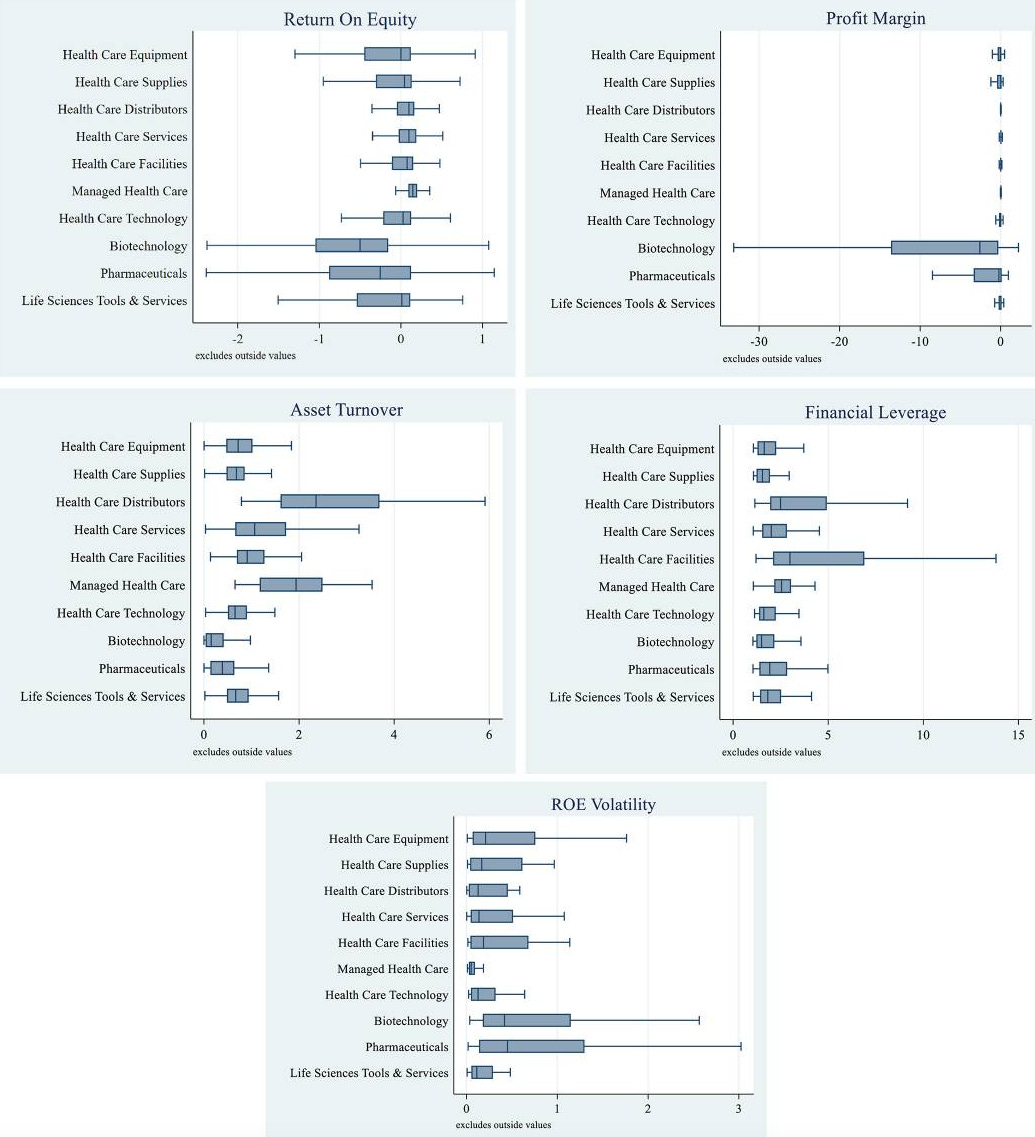
To support my views, I will reference a study that analyzed the 2010-2019 financial data of 1,231 publicly traded healthcare companies in the US.
The main metric it looks at is Return on Equity (ROE), which measures how efficiently a company generates profits from shareholders' investments, with a high ROE potentially signaling a more competitively advantaged company.
The rest of the metrics such as profit margin, asset turnover, etc. influence ROE. For example, higher leverage can lead to higher ROE rather than operational efficiency, as is the case with healthcare facilities (health systems).
The results are summarized in the charts below:
It found that while managed healthcare companies (payers) had the highest median returns on equity (ROE), the highest individual ROE values were reported by medical device and drug manufacturers.
Given the data I presented thus far, it should not be a surprise that commercial health insurers, healthcare facilities, and healthcare distributors place where they do. These are very difficult industries for subscale companies to survive in as competitive moats are usually primarily derived from scale economies.
This is not true to the same extent for drug and medical device companies, where subscale companies can potentially establish a strong competitive moat through patent protection.
Healthcare investors who do not have a risk appetite should not consider trying to pick investments in small drug or medical device companies.
I’ve created the following chart which reflects my simplified view of the investment potential of individual industry groups within the healthcare value chain. If you have pushback on my rankings, I’d love to discuss.
Specialty Med Devices - Enjoys advantages of Speciality Drug Manufacturers with higher odds of success, less regulation, and a faster path to profitability
Specialty Drug Manufacturers - High margins and pricing power from patent protection but faces high risks/costs in drug development and increasing regulatory pressure
Large Payers - High barriers to entry from economies of scale, stable/recurring revenue, strong negotiating power over providers/purchasers but still depends on manufacturers
Large Wholesalers - High ROC despite thin margins; strong scale economies but dependent on manufacturers
Diversified Med Devices - Defensible but faces higher pricing pressure compared to specialty manufacturers
Diversified Pharma - Defensible but faces high risks/costs in drug development and increasing regulatory pressure
Specialized Health Systems - Higher ROC than general hospitals due to higher quality care and more efficient cost control
Large Health Systems - Higher fixed costs and lower returns than specialized health systems; dependent on devices, drugs, and payer contracts
Small Payers - Challenging position given lack of scale but potential for M&A
Speculative Med Devices - High risk but better economics than Spec Pharma
Small Health Systems - Declining margins, weak negotiating power, and high operational costs but potential for M&A
Speculative Drug Manufacturers - Highest risk, lowest success rate, significant capital requirements
Independent Pharmacies - Significant margin pressure from payers without the upside potential of speculative drug manufacturers
Attempts at Reform
Despite the exorbitant costs and inefficiency in US healthcare, progress towards change has been slow and the industry has remained stubbornly resistant to change and innovation.
In this section, I will cover some attempts at reform thus far, both from the government and from industry.
Regulation
Healthcare reform has always been top of mind for regulators, and it was the second most important voting issue in the recent presidential election, just behind the economy. Nearly 8 in 10 US voters say healthcare is very important or extremely important to their vote.
As a result, certain issues like lowering drug prices have garnered bipartisan support. However, systematic proposals such as Medicare for All, which would have turned the US into a single-payer system, have mostly been dead in the water after facing fierce resistance from health system stakeholders and divided political support.
However, there have been numerous major regulations that have incrementally improved the US healthcare experience for Americans.
HIPAA (1996) - Transformed healthcare privacy by safeguarding patient data
Balanced Budget Act (1997) - Introduced Medicare Advantage and expanded coverage for low-income children and seniors
Medicare Modernization Act (2003) - Introduced Medicare Part D for prescription drug coverage and created Health Savings Accounts
HITECH Act (2009) - Incentivized the adoption of electronic health records
Affordable Care Act (2010) - Expanded coverage to over 20 million uninsured Americans by prohibiting coverage denials for pre-existing conditions, introducing health insurance marketplaces with subsidies, and Medicaid expansion
Medicare Access and CHIP Reauthorization Act (2015) - Shifted Medicare payments from fee-for-service to value-based care, incentivizing quality outcomes over volume
Inflation Reduction Act (2022) - Allowed Medicare to negotiate certain drug prices for the first time and limited out-of-pocket spending on drugs for Medicare beneficiaries to $2,000 annually
Healthcare stakeholders have lobbied intensely against these reforms and have continuously found ways to adapt to the regulations that have been passed and increase their bottom lines.
For example, the Affordable Care Act (ACA) instituted several mandates that increased costs for insurers, most notably the prohibition of coverage denials for pre-existing conditions and required coverage of 10 essential benefits on ACA plans. In response, insurers significantly narrowed their networks, which meant that average enrollees only had access to 40% of doctors in their area. This allowed insurers to negotiate lower reimbursement rates with providers, but it meant worse care for patients, with many being forced to pay out-of-pocket, especially for specialists.
Insurers were not the only ones to abuse the ACA to boost their bottom lines. One of the ACA’s benefits was to institute no-cost preventive screenings. However, when patients would go in for a free screening colonoscopy, they would be surprised when they were hit with a bill for removing a polyp - something that happens in 50% of colonoscopies.
This is not to say that regulation hasn’t made progress - it’s just been slow and incremental. Medicare now being able to negotiate drug prices is a big deal. Although it will only start with 10 drugs in 2026, it is expected to negotiate for another 15 drugs per year in 2027 and 2028, and 20 drugs per year in 2029 and beyond, saving patients billions of dollars.
Digital Health
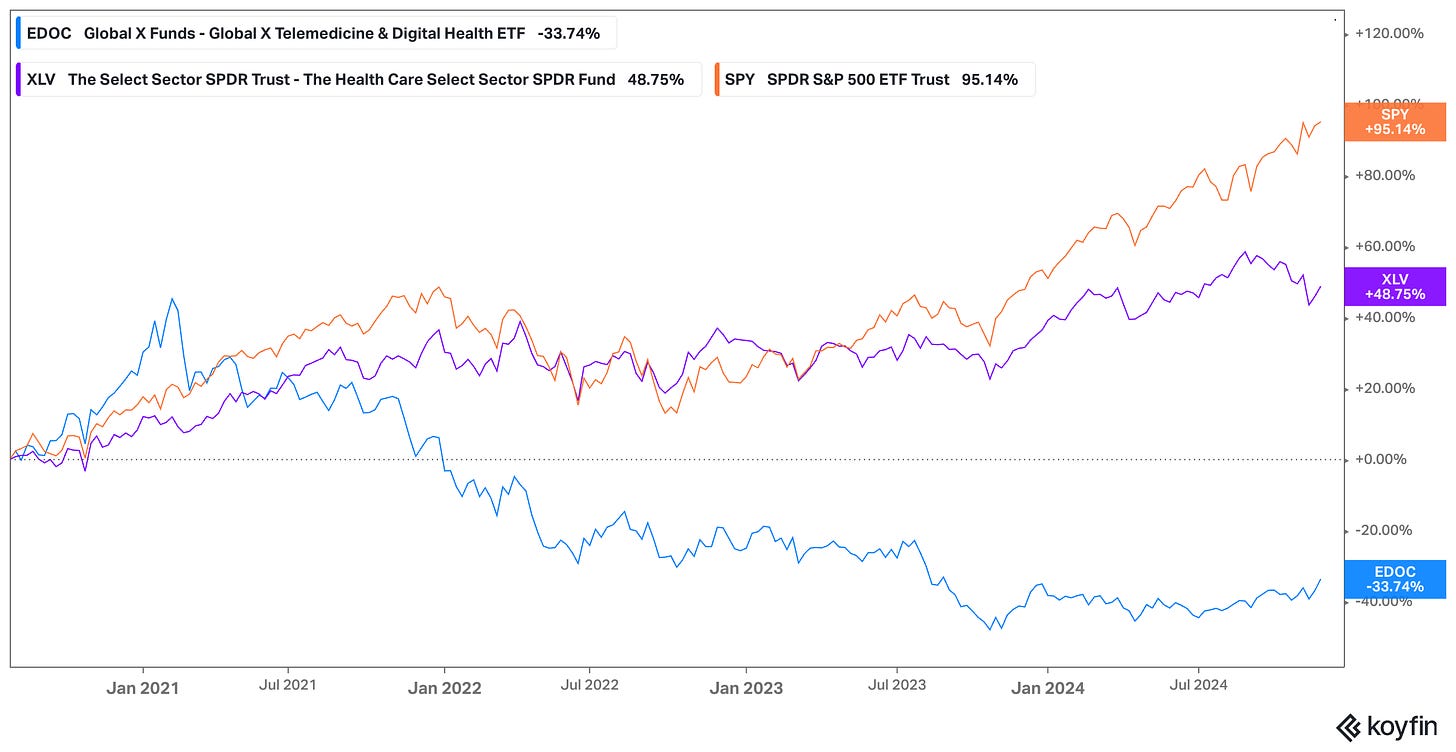
Digital health has historically been a poor industry to invest in, with 97% of health tech start-ups failing and the few public digital health companies severely underperforming the market.
EDOC, an ETF tracking digital health companies, is down over 30% since inception in July 2020, compared to the broad Health Care ETF which is nearly 50% over the same period.
In Bessemer Venture Partners’ State of Health 2024 report, they note that private market investments (number of rounds) have rebounded to pre-COVID levels according to Carta. However, the number of Series A and B financings continues to be depressed and of those that successfully raise, it takes 50% longer to get to Series A than any other industry.
One bright spot is in AI investments, which have driven median pre-money valuations back to peak 2021 levels. Health AI deals are being done at 30-50x EV/ARR multiples, compared to just 10-15x for other health deals!
Bessemer highlights a new category of AI services-as-software companies that leverage AI to replace entire functions. These multiples are justified by their revenue growth, with AI services-as-software companies scaling from $1M to $10M ARR in just 2.5 years at the median, compared to it taking 3-6 years for other health tech businesses.
As I’ll discuss in a later section, I believe that AI holds tremendous promise in modernizing the healthcare system and increasing efficiency, but technology also needs to be paired with business model innovation to solve the deep-rooted issues in the healthcare system.
Payment Models
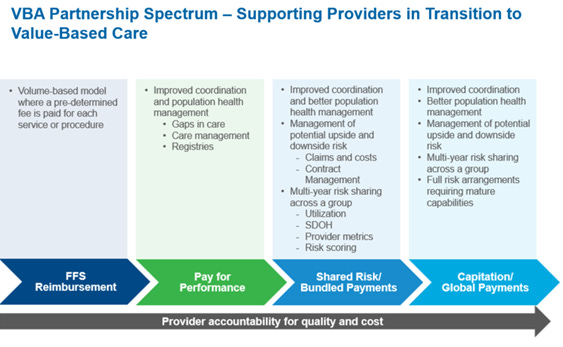
As I’ve discussed earlier, providers are incentivized to upcharge patients and deliver more treatment. This is because under fee-for-service (FFS) payment models, providers are paid for every service.
However, there is an alternative with value-based care, which ties payments to patient outcomes. It is estimated that companies who adopt a value-based care approach can save 3-20% on healthcare spending.
Currently, over half of healthcare payments were made through value-based reimbursement models, compared to 38% in 2019. Furthermore, 73% of payers expect alternative payment models to increase.
The largest payer of all, The Centers for Medicare & Medicaid Services (CMS), is targeting to move all Medicare lives and most Medicaid lives into risk-based programs by 2030.
I will discuss two prominent models - capitation and bundled payments.
Capitation
Value-based care existed in early forms through Health Maintenance Organizations (HMOs), which were popular in the 1990s, to control rising costs. HMOs typically use capitation to pay their providers, where providers receive a fixed amount per patient per unit of time to treat a patient for all their conditions.
Kaiser Permanente is a non-profit that started as a health system and has vertically integrated into insurance. Today, it operates as an HMO by charging members a fixed monthly premium for access to its exclusive provider network that delivers care as required.
This model aligns incentives to a higher degree than traditional insurers as providers are incentivized based on quality and not volume of care. However, although Kaiser has continued to be successful, many HMOs struggled as patients disliked the restrictive networks.
Capitation models were also criticized for incentivizing providing fewer services, not measuring outcomes at a patient level nor reflecting different patient-risk profiles, and encouraging further consolidation by only allowing in-network treatment.
Bundled Payments
While capitation and fee-for-service both suffer from undertreatment and overtreatment respectively and do not tie payments to improving outcomes, bundled payments takes a different approach and is supported by well-known scholars such as Michael Porter and Robert Kaplan of Harvard University.
Under bundled payments, providers are paid a fixed amount to treat a specific medical episode such as a medical condition or a procedure over a specific period of time.
Similar to capitation, the payer determines a fixed price for the episode based on historical cost data and expected outcomes, adjusted for patient risk profiles. Providers get to keep the savings if they can provide the care at a lower cost than the predetermined bundle amount, whereas they are liable to pay a portion of the losses if costs go over.
The Affordable Care Act of 2010 marked a further shift towards value-based care with programs such as Bundled Payments for Care Improvement (BPCI) and Accountable Care Organizations (ACOs), incentivizing bundled payments. It also introduced a mandatory program for bundled payments for joint replacements in 2016.
Although bundled payments avoid the undertreatment issue of capitation models, it also runs into overtreatment issues, as providers are incentivized to take on healthy patients and provide them with unnecessary care which would obviously lead to good health metrics afterward. It can also be difficult to measure patient health as current metrics like readmission rates and complication rates don’t capture the full picture of how successful a procedure was.
Key Takeaways
Healthcare reform has been incremental, despite significant regulatory efforts and capital poured into the sector. Incumbents have proven adept at circumventing and even leveraging well-intentioned regulations to boost their bottom lines. $100 billion has been invested in digital health since 2010 yet not a single generational company has come out of it, as this article states. Finally, value-based care still remains poorly implemented, leading administrative costs to continue to mount for health systems.
Industry Outlook
Although I’ve painted a bleak view of past attempts to reform the US healthcare system, I believe there have been few better times for reform than now. However, wholesale change will need to come through a combination of regulatory support and innovation in business and payment models that leverage new technologies.
AI Creating an “iPhone Moment” for Healthcare
AI has been touted to revolutionize many industries, but I believe there are few that stand to benefit as much as healthcare.
Consider the fact that healthcare produces 30% of the world’s data but up to 97% of it remains unused. AI can analyze vast datasets of patient data collected from claims, clinical history, wearables, and even smartphones to predict health conditions before they show symptoms and thus allow providers to intervene and improve outcomes.
Indeed, the AI in Healthcare Market is expected to grow from $14 billion in 2023 to $153 billion by 2029, a jaw-dropping CAGR of 48%!
I see four potential use cases in healthcare that AI can address:
Diagnosis
Problem: In the US, providers misdiagnose patients 11% of the time, leading to 371,000 deaths and 424,000 people becoming permanently disabled. Human judgment is imperfect and relies on potentially outdated medical knowledge and incomplete data.
Solution: Advances in generative AI make it possible for AI doctors to diagnose conditions more accurately and faster than humans. A recent study pitted doctors against LLMs in diagnosing real patient care cases. The median diagnostic accuracy for the docs using Chat GPT Plus was 76.3%, while the results for the physicians using conventional approaches was 73.7%. However, the accuracy of Chat GPT Plus alone came in at a whopping 92%!
Personalized Treatment
Problem: Health coverage for prevention is sparse, with only 25% of large employers offering comprehensive health screening and access to health improvement programs, most of which are far from consumer-friendly. The CDC estimates that as much as 80% of heart disease, stroke, and type 2 diabetes cases and 40% of cancer cases could be prevented through modification of lifestyle behaviors.
Solution: Remote monitoring devices such as wearables can be used to track patient health over time, allowing for more nuanced measurements of the quality of outcomes to tie payments to and provide personalized treatment. Today, an estimated 20-30% of US adults already own a wearable that is constantly collecting important health data. Through start-ups like Function Health and Superpower, users can potentially have 24/7 access to the smartest doctors in the world who have all their data for a price that most people can afford.
Drug Discovery
Problem: As I mentioned in the pharma section, drug development typically takes 10-15 years and costs $2 billion per drug on average. A major driver of this cost is the staggering nearly 90% failure rate in clinical trials.
Solution: AI can reduce early discovery time and costs by 70-80% and reduce development timelines to 4-5 years. Recently, DeepMind’s AlphaFold 3 achieved an unprecedented 50% higher accuracy than traditional methods in predicting drug-like interactions.
Operations Management
Problem: Administrative tasks account for 25% of all US healthcare spending. The largest cause of healthcare waste is also administrative waste. Among the 25 largest US payers, 85% identified automation as one of the most significant levers for reducing administrative costs. Furthermore, nurses only spend 21% of their time on direct patient care today due to administrative tasks; AI could help address this and lead to better patient care.
Solution: Citi notes automation could save 25-30% of current spending on administrative tasks, amounting to hundreds of billions of dollars. Some start-ups addressing this include Cohere Health which expedites health insurance approval using AI and Abridge which automates medical records using AI.
One of the growing industries I am most excited about is longevity. I will dive deeper in a future write-up on the digital health landscape, but longevity start-ups leverage advances in diagnosis and personalized treatment to extend human lifespans.
Two start-ups that I am bullish on in longevity are Function Health and Superpower.
Function Health helps members understand their health and track it over time, detecting health issues before they show symptoms. Members pay a $499 annual fee out-of-pocket and go for two annual blood tests which track over 100+ biomarkers. This data is then analyzed by a combination of the best AI and human clinicians. Through AI, Function can leverage the latest medical research to provide world-class detection at an affordable price. Its investors include a16z, Matt Damon, Kevin Hart, and Wisdom VC and it already has over 400,000 people on its waitlist.
Superpower Health is another company focused on longevity using AI. Similar to Function, Superpower users pay out-of-pocket and do an annual lab analysis from their home, which is used by Superpower’s medical team to design a custom health strategy that improves every aspect of patients’ health. Its investors include the Winklevoss twins and Balaji.
Consumers Will Lead the Change
In the past, I’ve been optimistic about digital health companies with alternative business models gaining traction through widespread adoption by self-insured employers and patients fed up with rising premiums.
My thesis in Teladoc was that it could become a risk-based digital primary care clinic leveraging remote monitoring devices like Livongo to track patient health and intervene only when necessary through telemedicine consultations. It soon became clear that patients were very sticky with their existing providers, the patient experience was poorly integrated, and there were too many competitors making it difficult to get distribution and bring customer acquisition costs (CAC) down - a very common issue for digital health companies.
While I was overly optimistic about virtual care adoption post-COVID, I believe that I was directionally correct with the theme of AI-powered primary care and that recent advances in AI over the last two years have made a new generation of start-ups such as Function and Superpower Health possible.
While go-to-market will continue to be the biggest challenge, there is ample evidence that multi-billion dollar companies can be built outside of the incumbents. Today, 82% of US consumers consider wellness a top priority and they are increasingly looking for products and services that help them to live a healthy lifestyle.
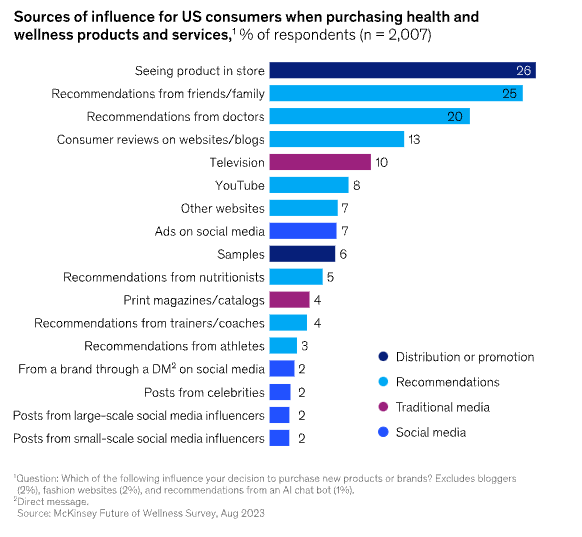
According to a 2023 study by McKinsey, recommendations from friends and family outpaces recommendations from doctors in influencing consumers to buy a health and wellness product.
A great case study for DTC business models in healthcare is Hims, which has managed to scale to a nearly $1.5 billion annual revenue run rate by selling medications primarily for ED. With its primary differentiation being its branding and first-mover advantage, its success speaks to the potential for consumer-oriented digital health companies.
Conclusion
US healthcare is broken. What should be a system focused on improving patient outcomes and ensuring access has evolved into one that is focused on profits above all else. Relaxed regulation, misaligned incentives that prioritize volume of care over quality, and increasing vertical and horizontal integration among its constituents have all contributed to exorbitant costs for patients.
At its simplest today, healthcare businesses succeed much like they do in other sectors: through specialization or through scale. The best businesses combine both to achieve monopolies in massive industries such as IDEXX Laboratories in pet healthcare diagnostics or Intuitive Surgical in robotic surgery.
I am excited about the future. I believe fixing healthcare represents one of the greatest opportunities today. The convergence of emerging technologies, growing consumer interest fueled by rising premiums, and payer pressure to adopt value-based payment models that align incentives make this an ideal moment for change.
The US healthcare industry is much too large for one deep dive to cover but I hope I’ve given you a sufficient understanding to start to form your own theses. I aim to dive deeper into specific industries within healthcare in the future, such as digital health.
If you have any feedback, I would love to hear from you. Please email me at richard.chu [at] queensu.ca or comment below.
Feel free to follow or connect with me on LinkedIn for everything investing and tech/healthcare.
Thanks for reading,
Richard
Special thanks to Razi Syed, digital health entrepreneur, for proofreading and suggesting helpful resources for this article. Follow him on LinkedIn and Twitter.
I do deep dives into industries and companies within tech/healthcare.
If what I’m writing about resonates with you, please subscribe and consider sharing with others who might benefit.
If you are getting a lot of value, I appreciate all subscription upgrades, but my content will remain free.
Disclaimer: Nothing in this article is intended or should be construed as investment advice. Everything I’ve written is for educational purposes only.

